

This guide will walk you through the steps to seamlessly connect your Datadog account with Upstash for enhanced monitoring and analytics.
Integration Scope
Upstash Datadog Integration only covers Pro databases, databases with the Production Pack, and those included in the Enterprise Plan.
Step 1: Log in to Your Datadog Account#
- Open your web browser and navigate to Datadog.
- Log in to your Datadog account.
Step 2: Install Upstash Application#
- Once logged in, navigate to the “Integrations” page in Datadog.
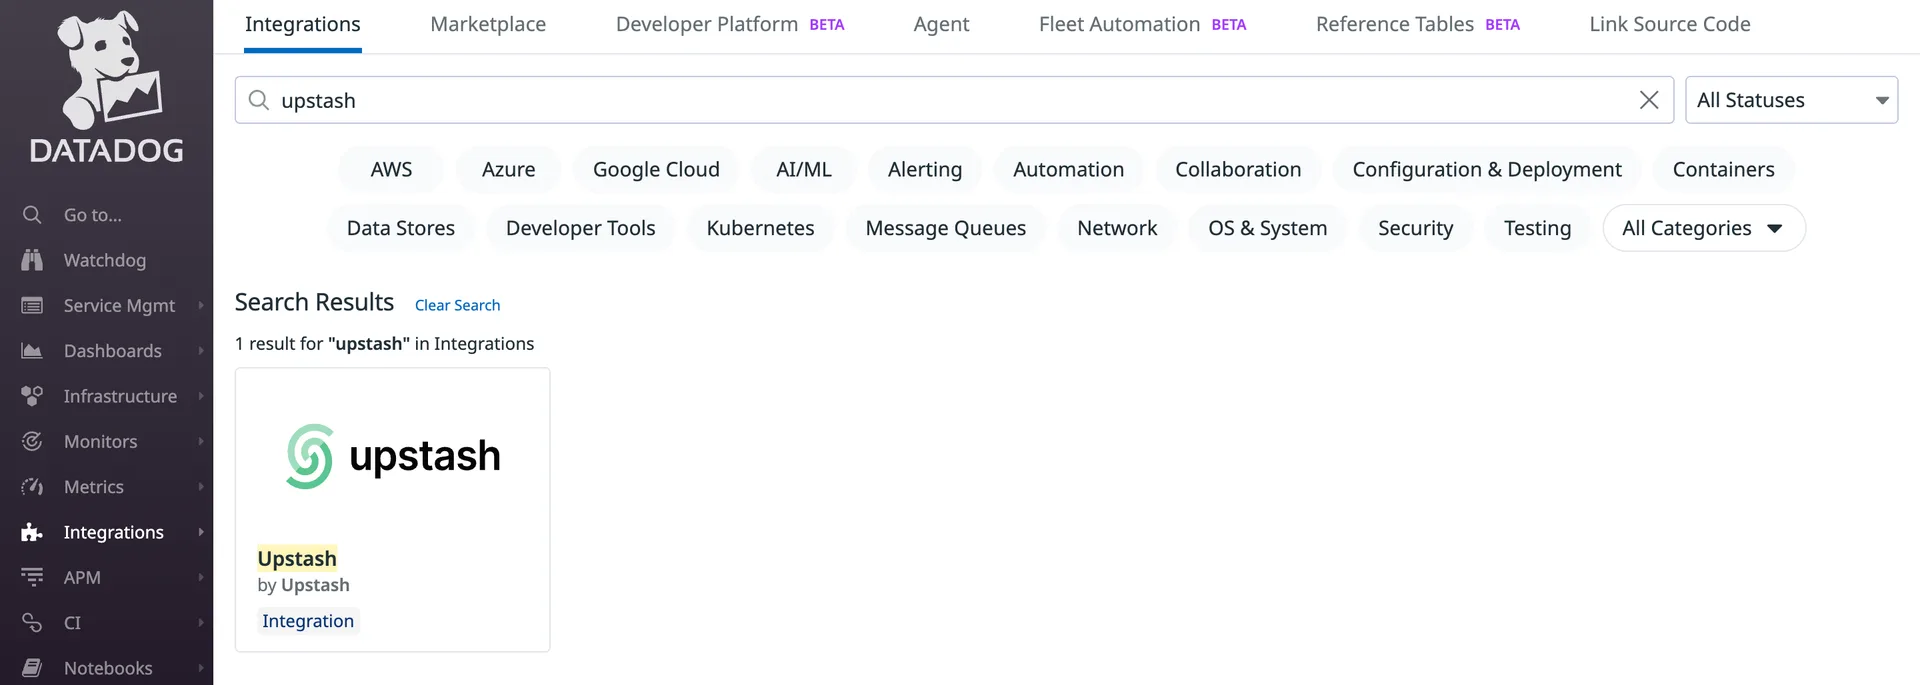
- Search for “Upstash” in the integrations list and click on it.
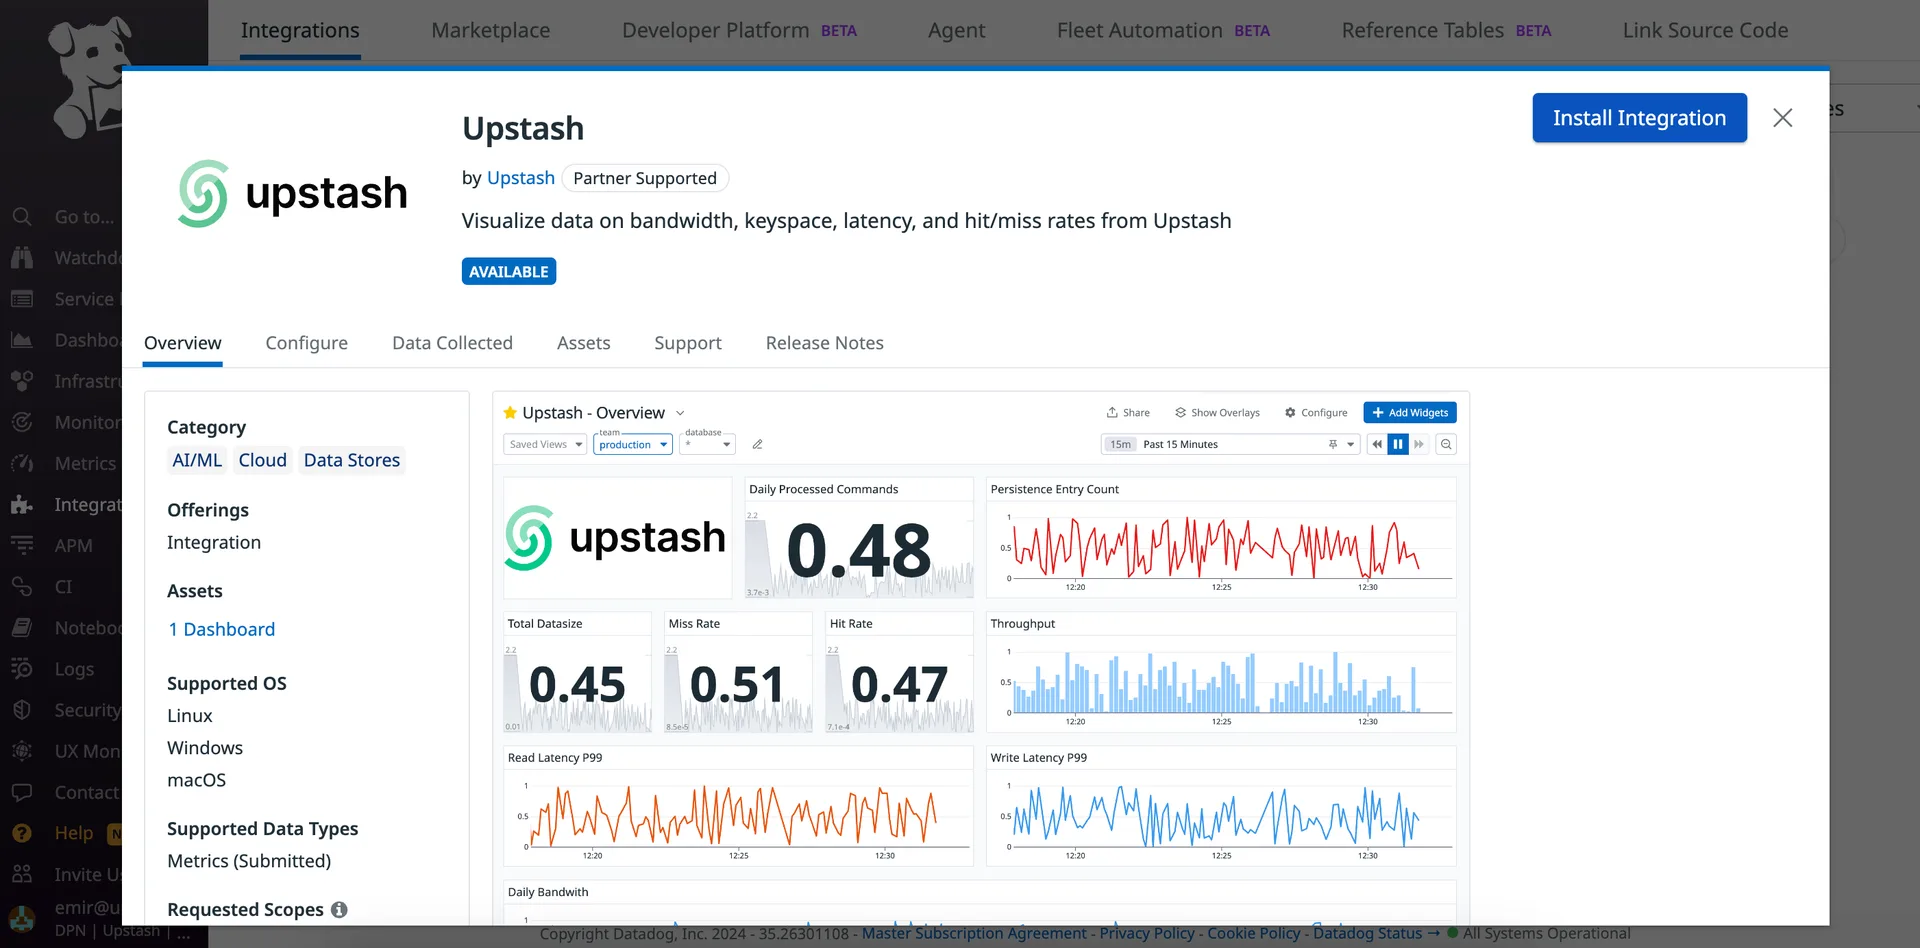
Let’s click on the “Install” button to add Upstash to your Datadog account.
Step 3: Connect Accounts#
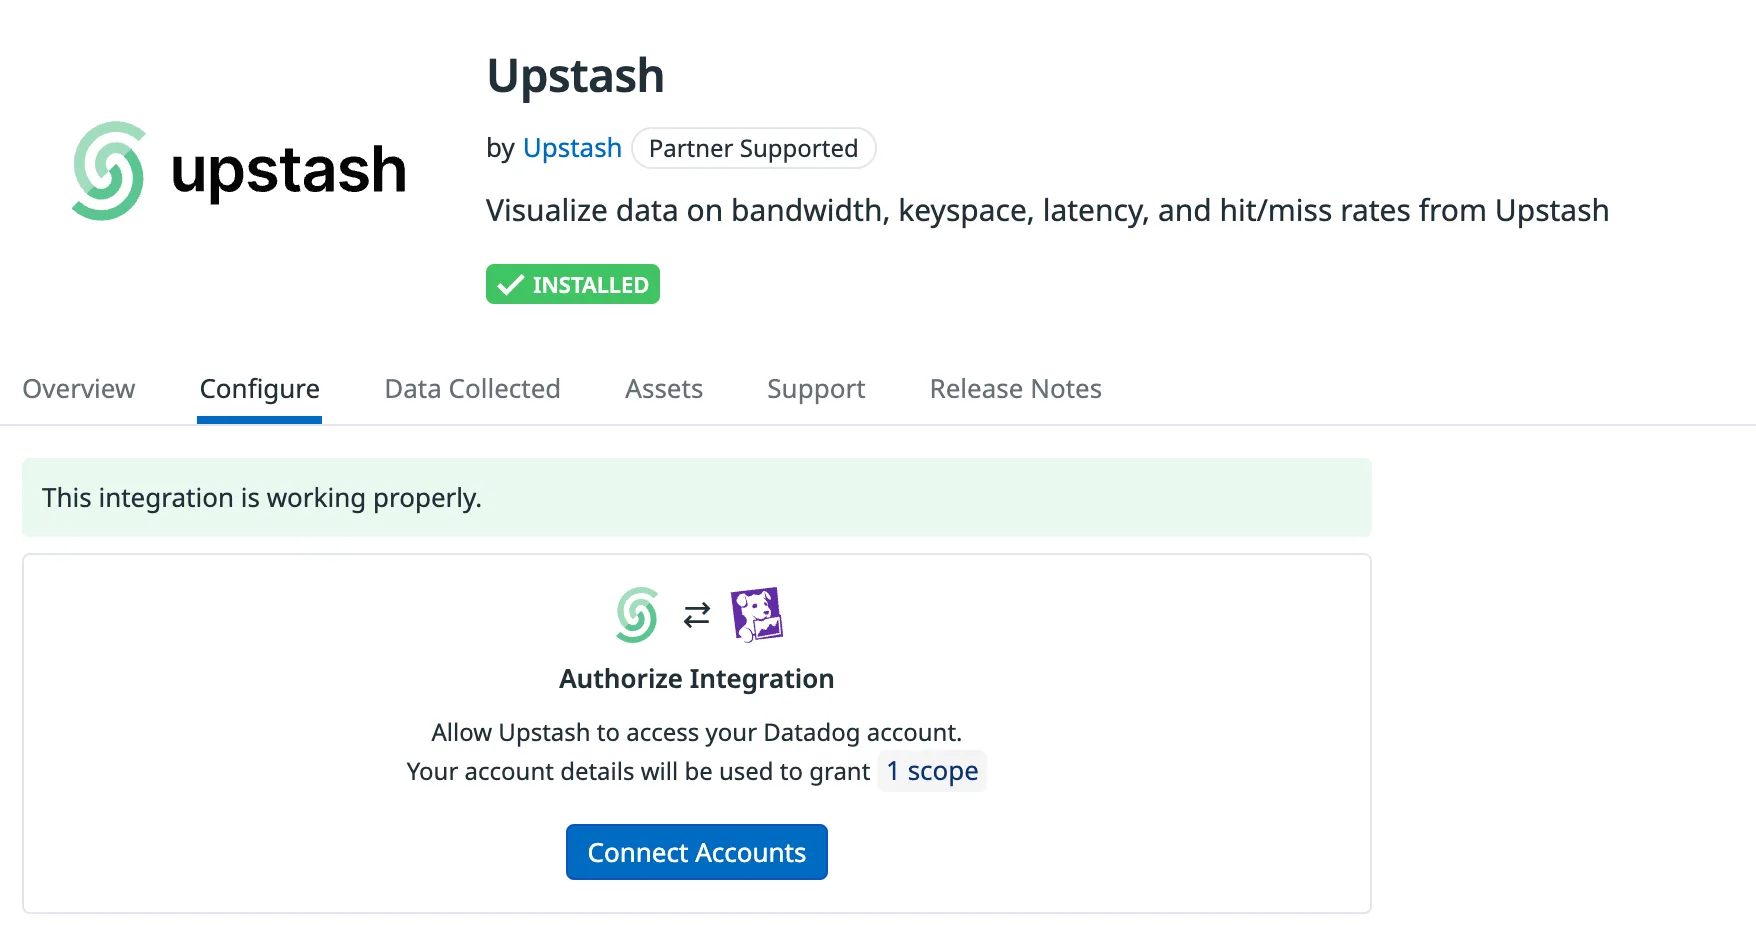
After installing Upstash, click on the “Connect Accounts” button and Datadog will redirect you to the Upstash site for account integration.
Step 4: Select Account to Integrate#
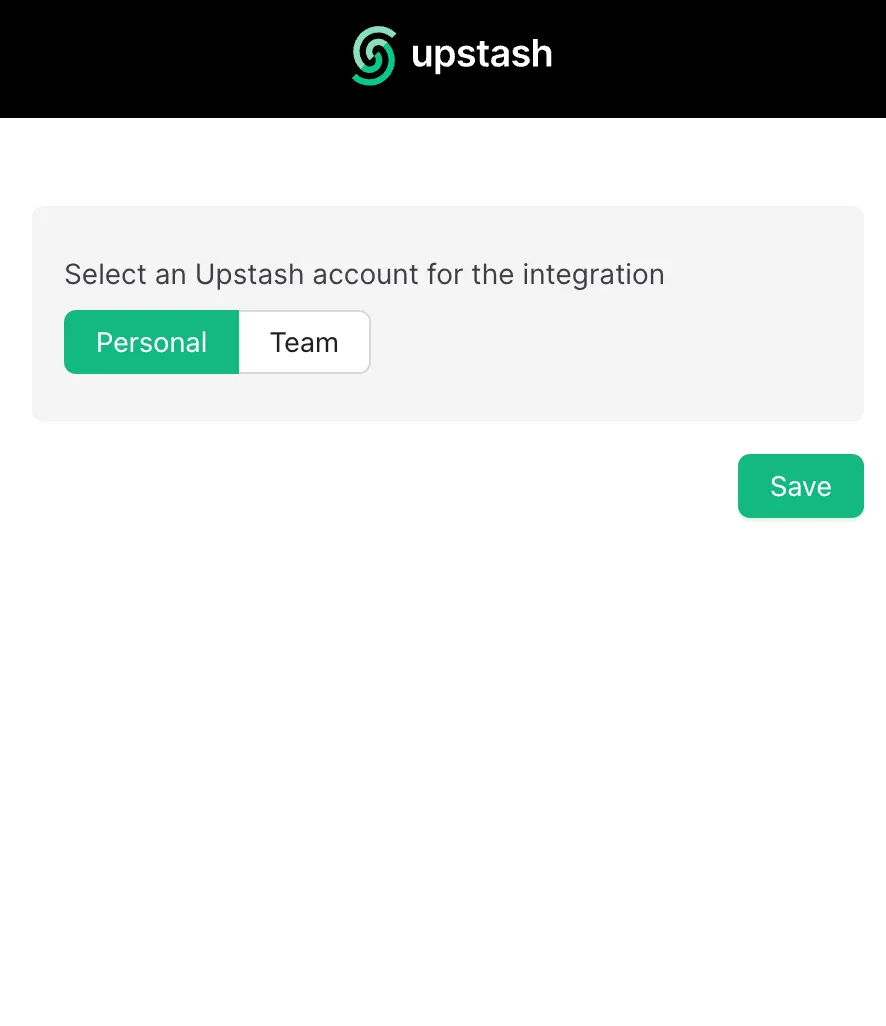
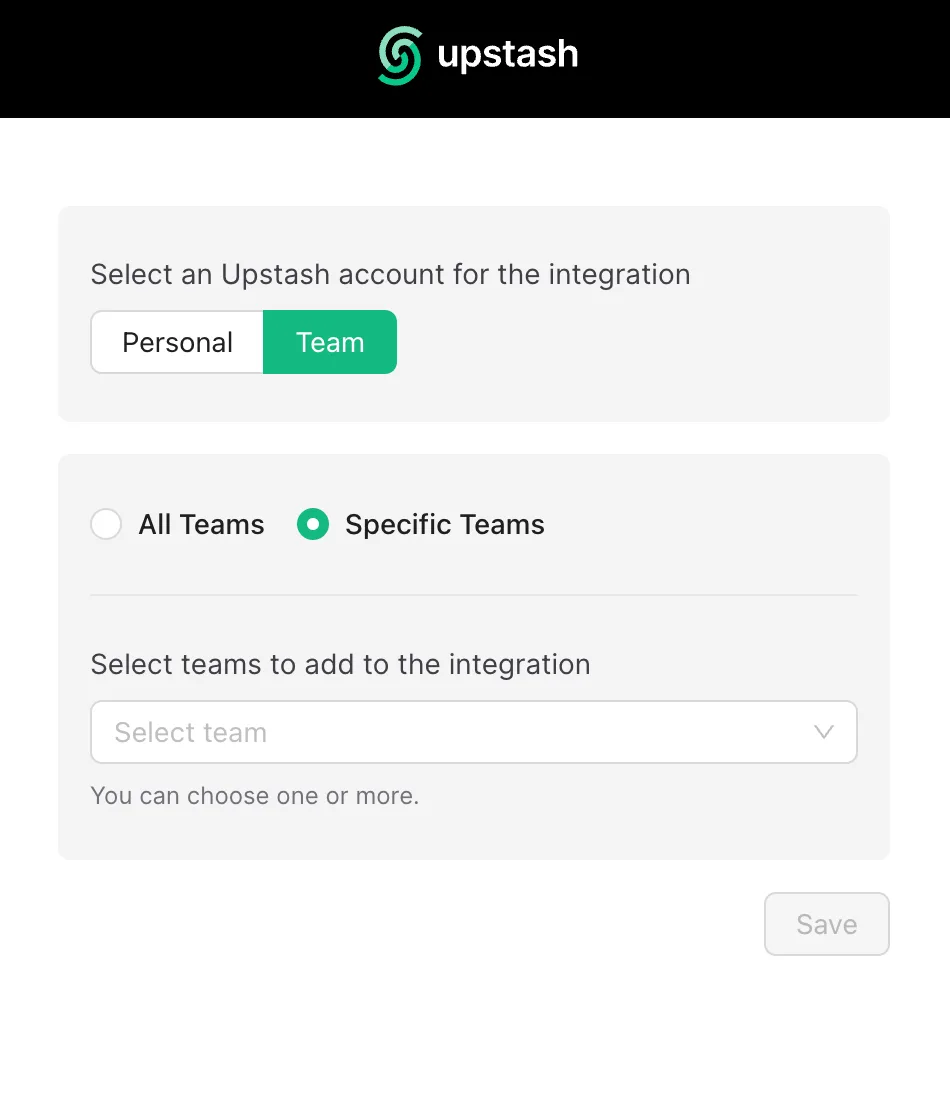
- On the Upstash site, you will be prompted to select the Datadog account you want to integrate.
- Choose the appropriate Datadog account from the list.
Upstash Datadog Integration allows you to integrate personal and team based accounts.
Caveats;
- This integration can only be executed only one time.If you would like to extend list of the team in integration please re-establish the integration from scratch.
Step 5: Wait for Metrics Availability#
Once you’ve selected your Datadog account, Upstash will begin the integration process and please be patient while the metrics are being retrieved. This may take a few moments.
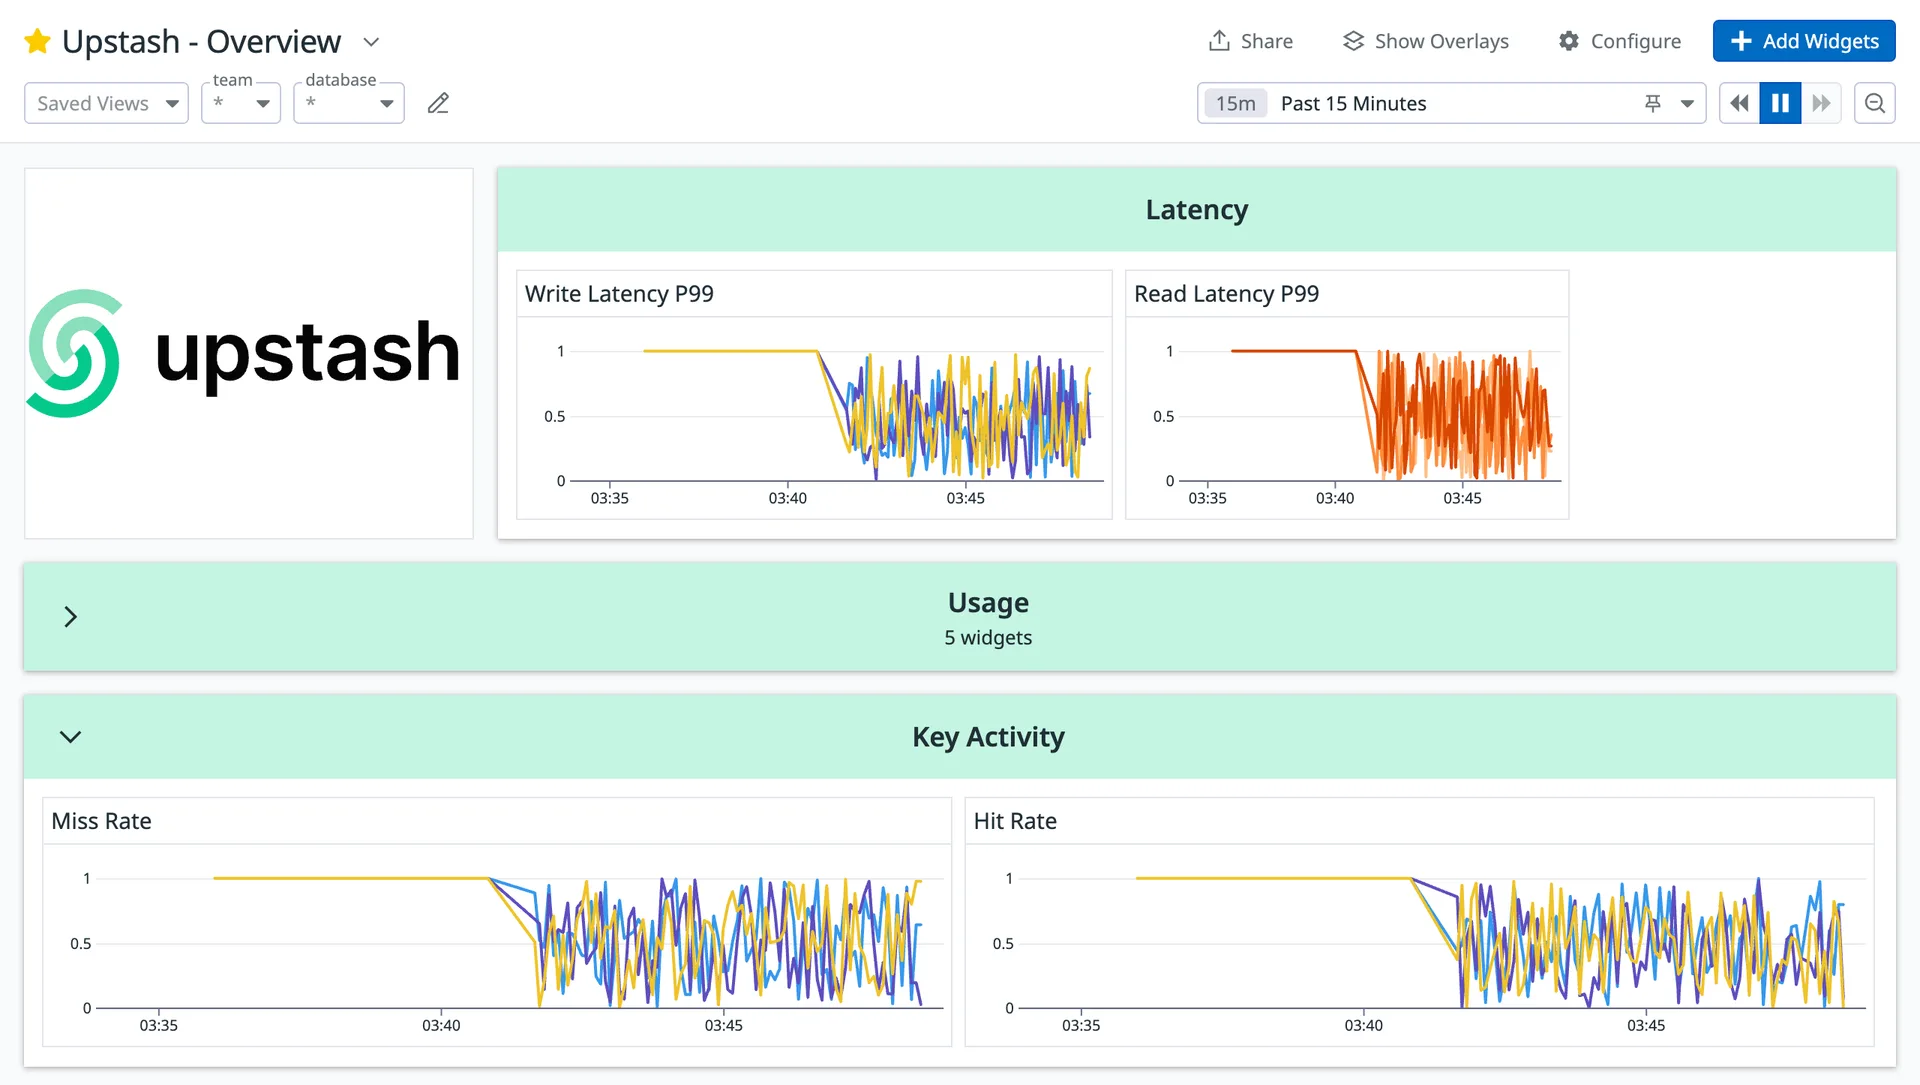
And here we go, metrics will be available in Upstash Overview Dashboard !
Step 6: Datadog Integration Removal Process#
Navigate to Integration Tab on your Datadog account,
Once logged in, navigate to the “Integration” tab and continue with Datadog part. If you would like to remove your integration between Upstash and Datadog account press “Remove”.
Confirm Removal:#
Upstash will suspend all metric publishing process after the you remove Datadog Integration.
After removing the integration on the Upstash side, it’s crucial to go to your Datadog account and remove any related API keys or configurations associated with the integration.
Metrics Published#
Metrics arrive in Datadog under upstash.db.<metric> with team and database tags, refreshed every few minutes. Latencies are in milliseconds over the last ten minutes; a latency with no samples in that window is not sent.
| Metric | What it measures |
|---|---|
dailyprocessedcommands, dailyreadcommands, dailywritecommands | Commands today, and the read and write share |
monthlycommands | Commands this month |
readpersecond, writepersecond, throughput | Commands per second by type, and in total |
hitrate, missrate | Key hits and misses per second |
connections, restconnections | Open TCP and REST connections |
totaldatasize, keyspace | Data size in bytes, and number of keys |
dailybandwidth, dailybandwidthin, dailybandwidthout | Bandwidth today, total and by direction, bytes |
monthlycost | Cost this month |
overalllatencyp50, overalllatencyp99 | Simple service latency: server time from reading a request to writing its response, for requests where every command is a single-key read or write; multi-key commands, scripts and cross-region requests are excluded |
readlatencyp50, readlatencyp99, writelatencyp50, writelatencyp99 | Read and write request latency |
overalllatencyp90 | Simple service latency, p90 |
enginelatencyp99 | Time the engine spent executing commands, excluding network and queueing |
lockwaitlatencyp99 | Time commands waited for the execution lock |
replicationlatencyp999 | Time writes were held because of replication, p99.9 |
lualatencyp50, lualatencyp99 | Lua script execution latency |
throttledcommands | Writes delayed today because persistence was falling behind |
authfailures | Refused authentications and commands sent before authenticating, per second, over TCP and REST. REST requests over the rate limit are counted here as well |
restcommands | Commands received over REST today |
expiredentriespermin | Keys removed per minute because their TTL passed |
replicationlag | Updates written on the primary that have not yet been sent to the replica |
oversizerequests, oversizerecordaccesses | Requests over the request size limit, and accesses to keys over the record size limit, today |
keyspacenotifications, connectionsopened | Keyspace notifications sent and TCP connections opened, per second |
luaexecutions, luacommands | Script executions today, and the commands they ran |
luafailures, luatimeouts, luamemorylimits | Script runs today that failed, timed out or hit the memory limit |
undeliverable | Requests and connections the Upstash proxies could not hand to any replica today |
Pricing#
If you choose to integrate Datadog via Upstash, there will be an additional cost of $5 per month. This charge will be reflected in your monthly invoice accordingly.
Conclusion#
Congratulations! You have successfully integrated your Datadog account with Upstash. You will now have access to enhanced monitoring and analytics for your Datadog metrics.
Feel free to explore Upstash’s features and dashboards to gain deeper insights into your system’s performance.
If you encounter any issues or have questions, please refer to the Upstash support documentation or contact our support team for assistance.