Rebuilding Observability for QStash and Upstash Workflow

An async execution model is only as good as your ability to see into it. When a workflow spans hours, retries, and fans out into thousands of steps, you need an observability layer built for the shape of the system.
Today we're shipping exactly that: a ground-up rebuild of the observability stack behind QStash and Upstash Workflow. It's faster, deeper, and designed for teams running mission-critical workloads at scale.
Why we rebuilt it
QStash's persistence layer was built on Upstash Redis from day one, and Redis is still the right substrate for the hot path. Lua gives us transactional message-state transitions, sorted sets drive delivery, and the operational profile is well understood at our scale.
Similarly, the telemetry stack was built on Upstash Redis with a periodic collector for the aggregated metrics. But pre-aggregated metrics only answer the questions you thought to ask ahead of time. At scale, the questions you actually need to ask are the ones you couldn't predict.
Over the last quarter we rebuilt the observability stack behind QStash and Workflow from the storage layer up, and it's now live for every user.
Here's what that unlocks.
Log Search Histogram
Every search now renders a histogram of match counts across the selected time range. You see the distribution of events before you dig into individual logs: anomalies, trend inflection points, and post-incident recovery curves are immediately visible.
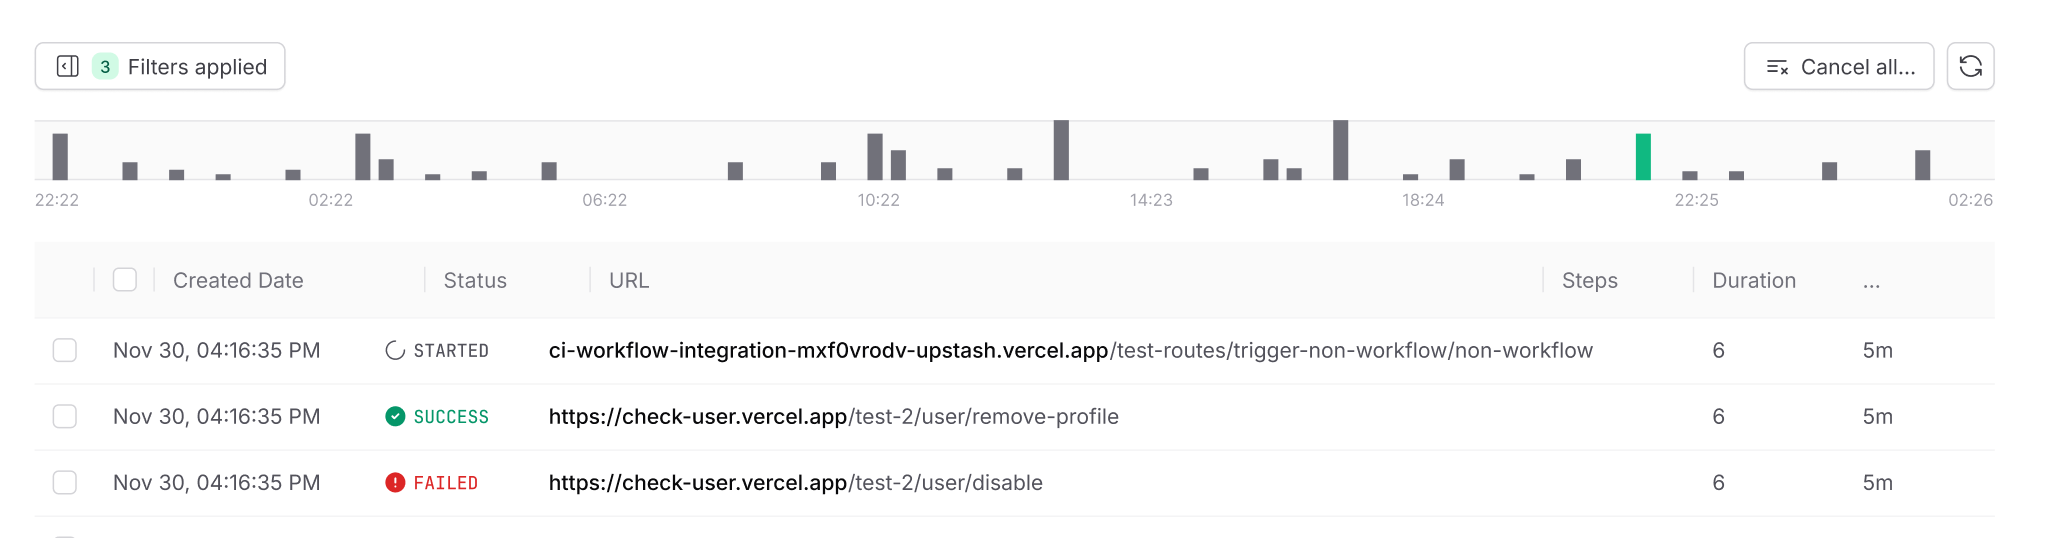
Click-and-drag to zoom into any window. Spotting the exact minute an error storm started, or watching error rates decay after a rollback, is now a two-second interaction instead of a ten-minute grep.
Top N Values
Filtering used to require knowing the exact value you were looking for: the full URL, the complete flow-control key. That's fine when you know what you're hunting, but hard to use when you're exploring.
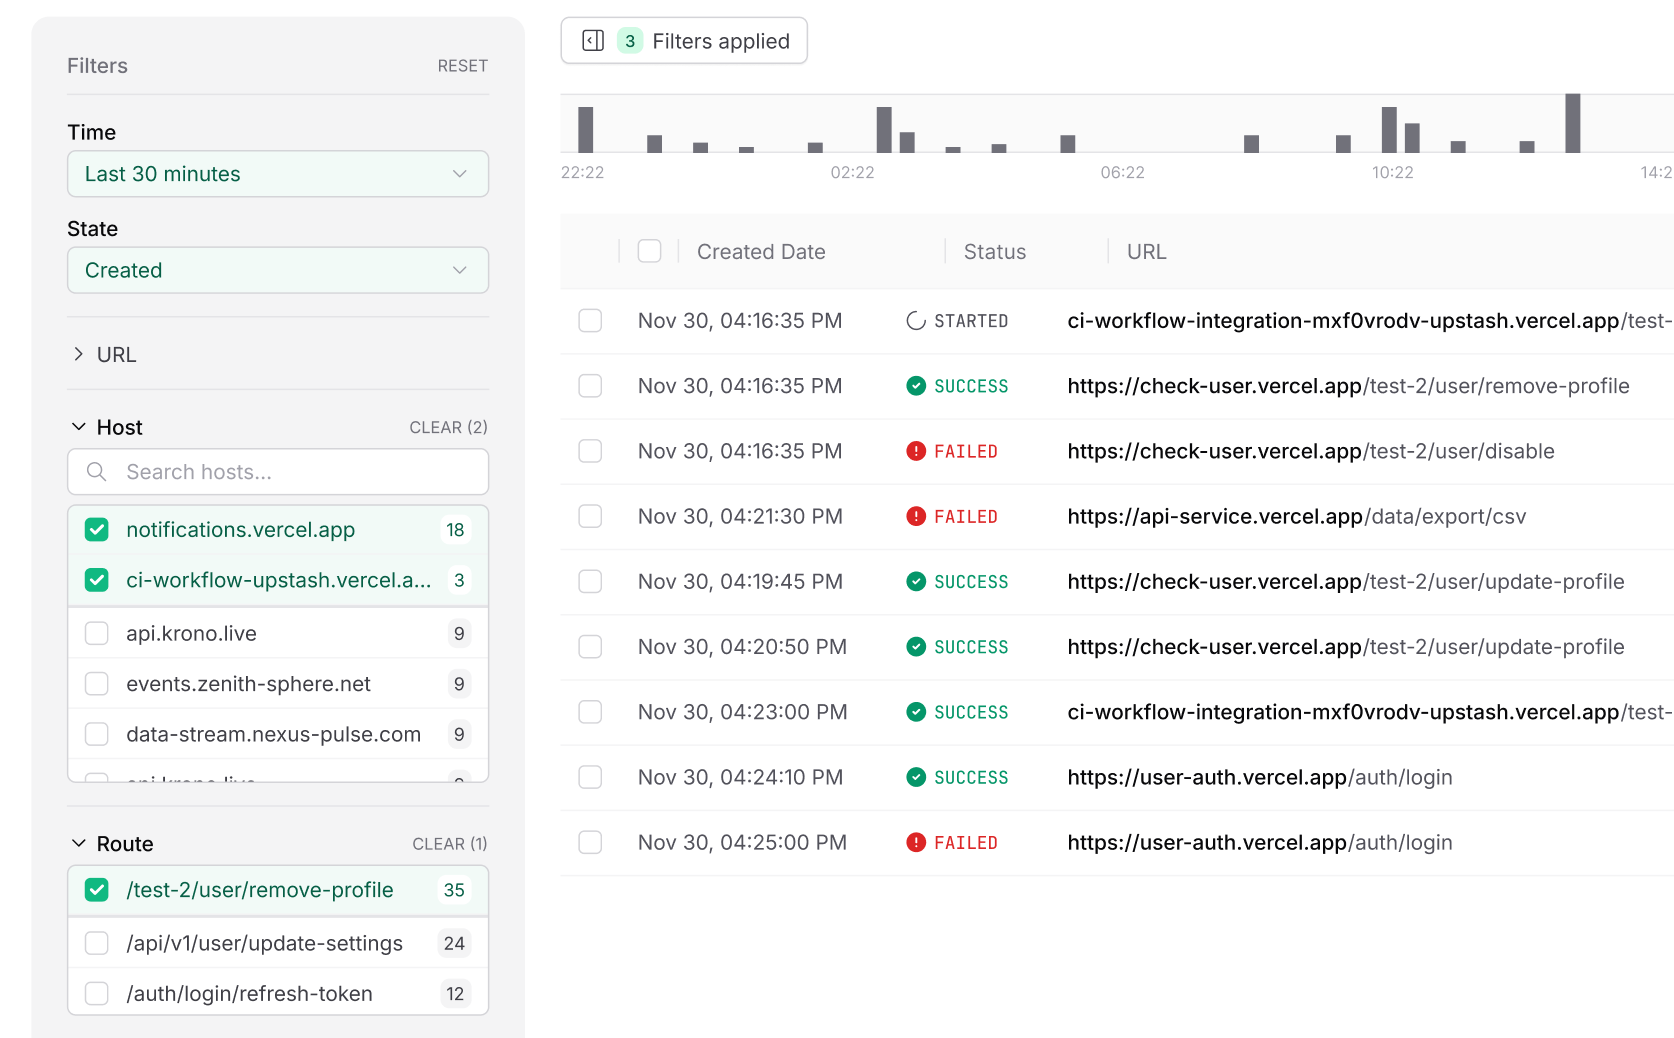
We now surface the top distinct values for any field in the selected time range, each annotated with its match count. You can pick from the ranked list, narrow your query incrementally, or free-text search when the value you want isn't in the visible set.
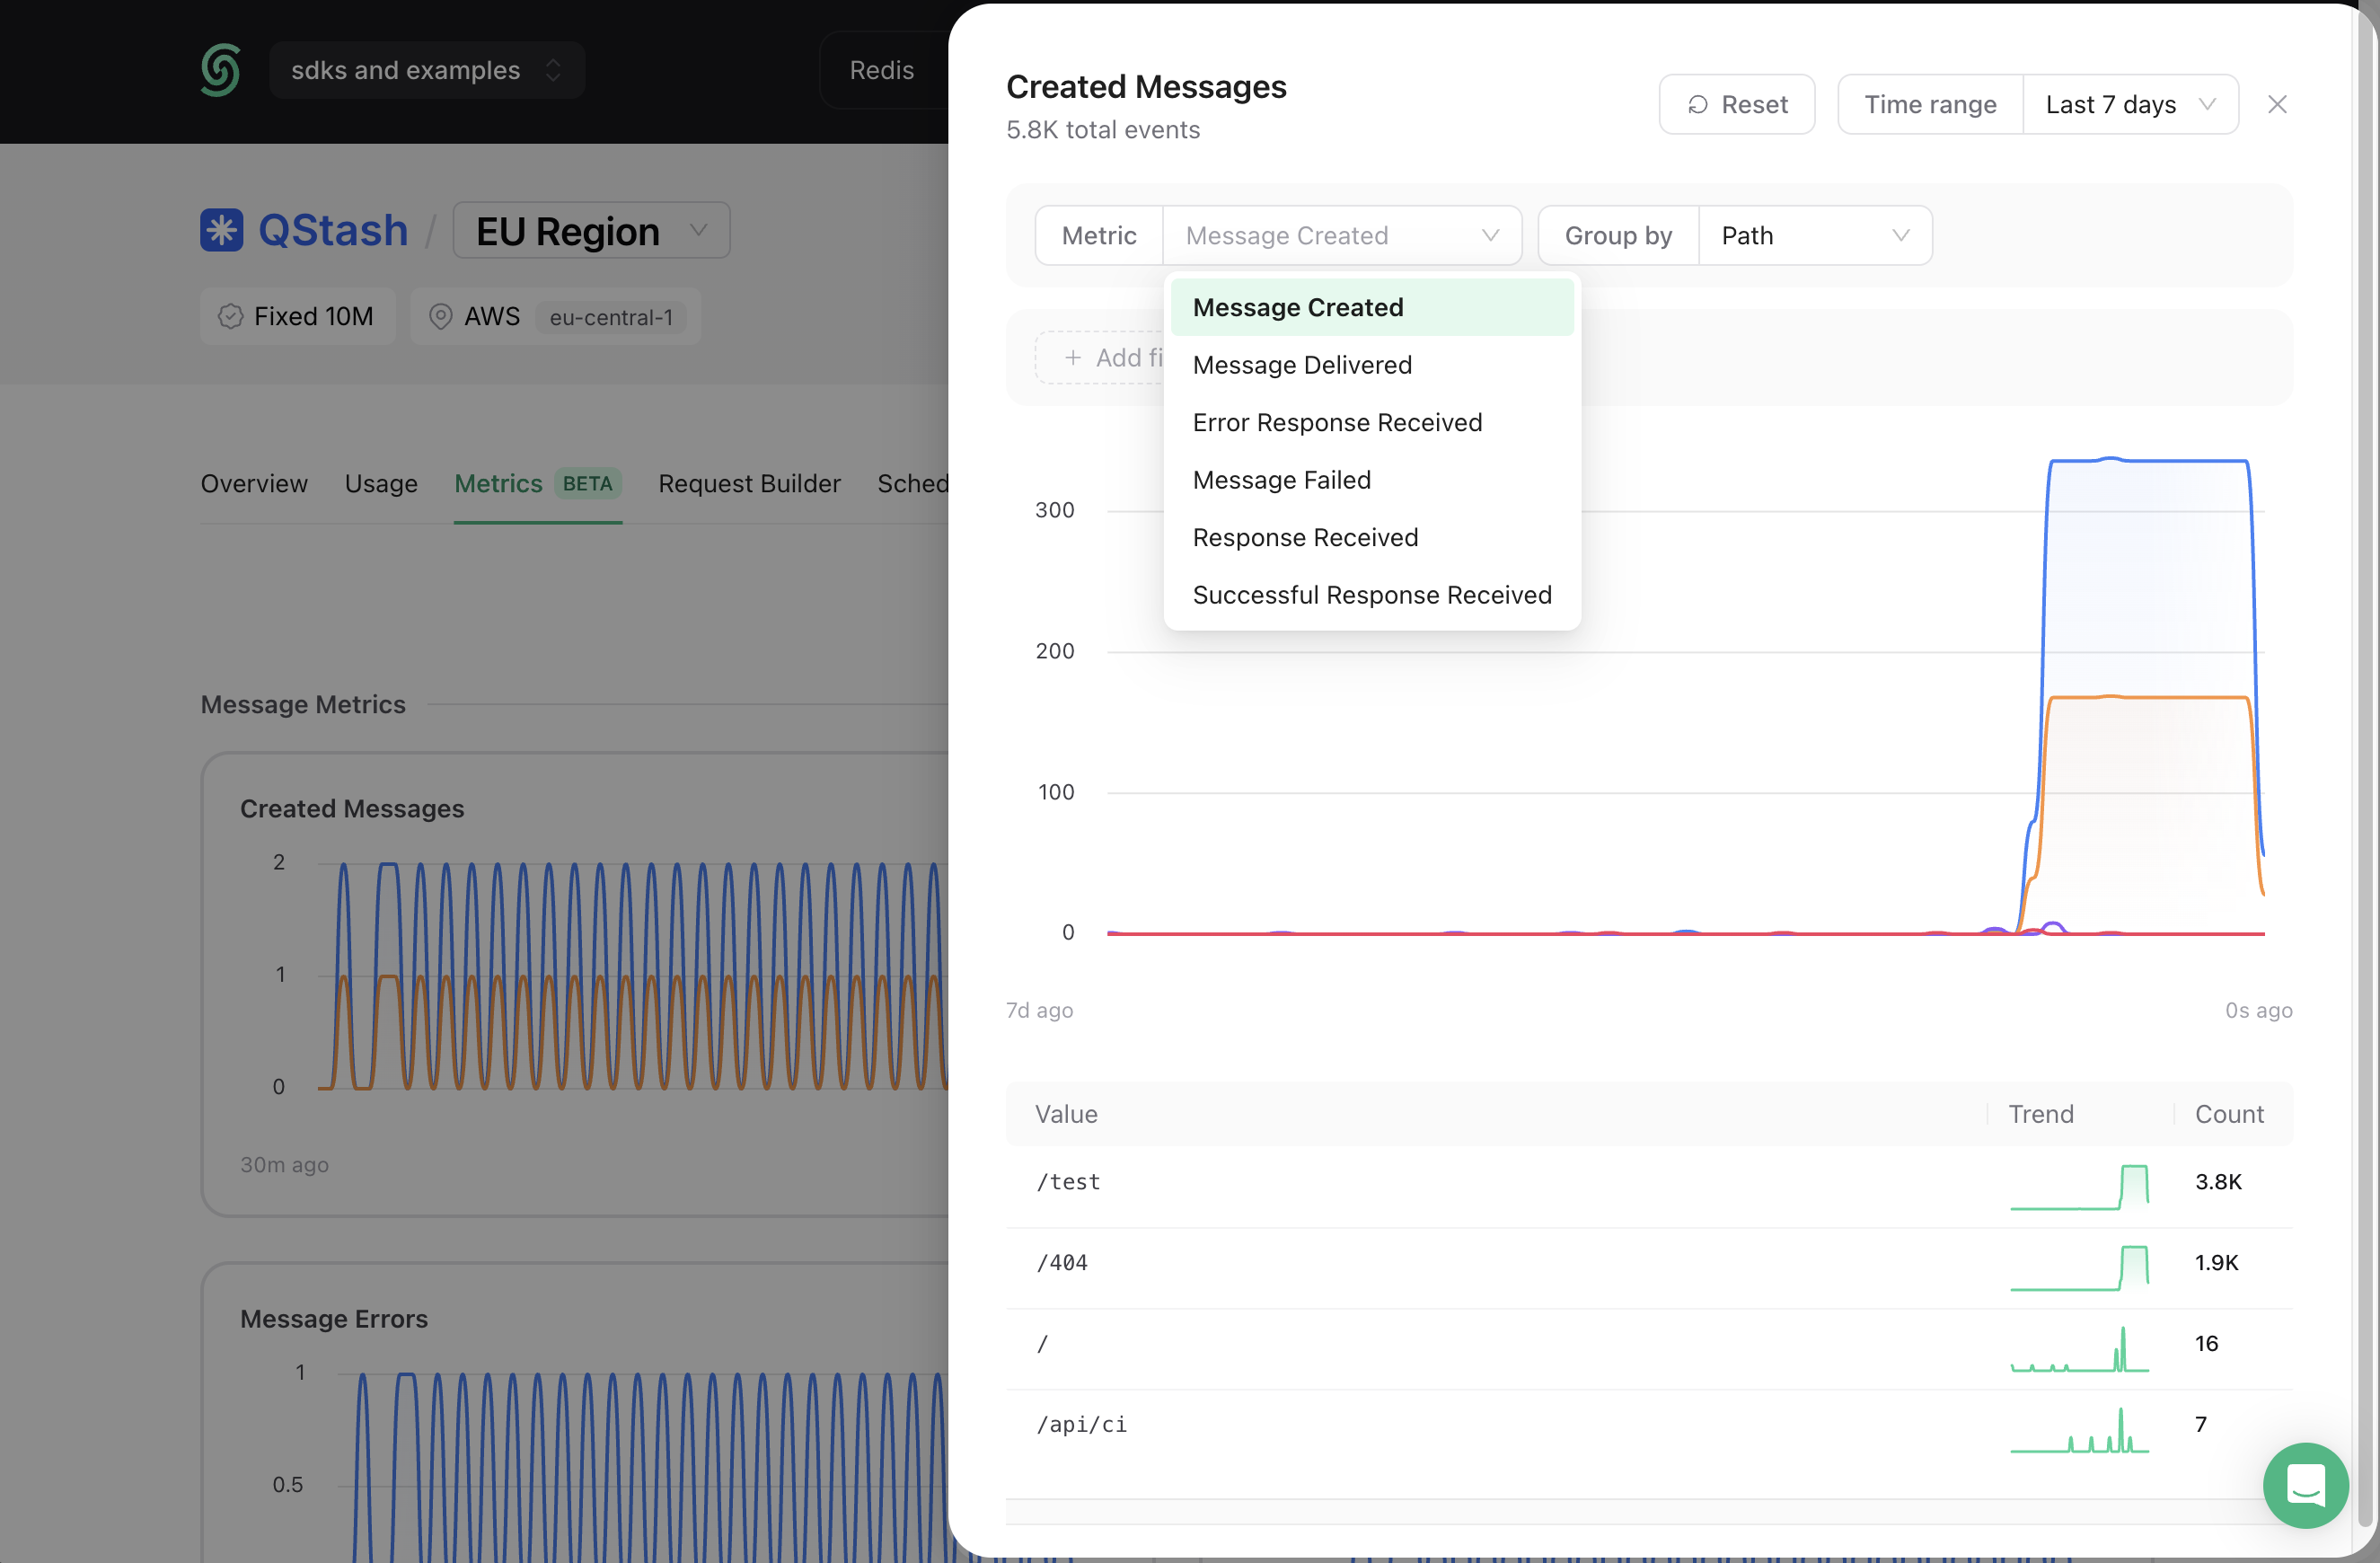
Metrics Tab
This is the largest piece of the rebuild. The new Metrics tab exposes the full set of logs QStash and Upstash Workflow emit, and lets you compose your own views on top of them.
Every metric supports:
- Arbitrary group-by on any field: URL, flow-control key, path, HTTP status, label, and more.
- Composable filters to scope a chart to a single host, a specific tenant, a deployment, or any slice you care about.
- On-the-fly computation: no pre-aggregation, no waiting for a rollup job. You define the view, we compute it.
We ship a curated set of preconfigured charts out of the box:
QStash
- Message throughput, failure rate, and retry rate
- Request durations
- Response status code distribution
Upstash Workflow
- Step-level latency
- Step success, failure, and retry counts
- Run started, success, and failure counts
What's next
The rebuild is live for every QStash and Upstash Workflow user today, at no additional cost. Our roadmap is as follows:
- Enrich Metrics tab with additional metric types and visualization formats
- Save and share custom charts and dashboards
- Alerting on custom queries and thresholds
If you're running QStash or Upstash Workflow in production and want a closer look, feel free to reach out. We're working directly with teams to make sure the platform scales with whatever you throw at it.