How Upstash Monitors 25+ Clusters Across the Globe
We're building Upstash's infrastructure to be cloud-agnostic by design. Everything works the same whether our services run on AWS, GCP, or Fly.io. This consistency and standardization (as I'll get into later) make it much easier to keep our promise of
- Low latency ⚡
- High availability 💡
for Upstash Redis, QStash, Vector, and all other services.
But this model introduces operational complexity. We currently run over 25 isolated Kubernetes clusters across multiple cloud providers and regions. That puts a lot of responsibility on our monitoring.
It's incredibly important to distill metrics into easy-to-scan dashboards made for humans. If we don't get monitoring right, maintaining basic visibility, let alone managing incidents, would be extremely chaotic 💀
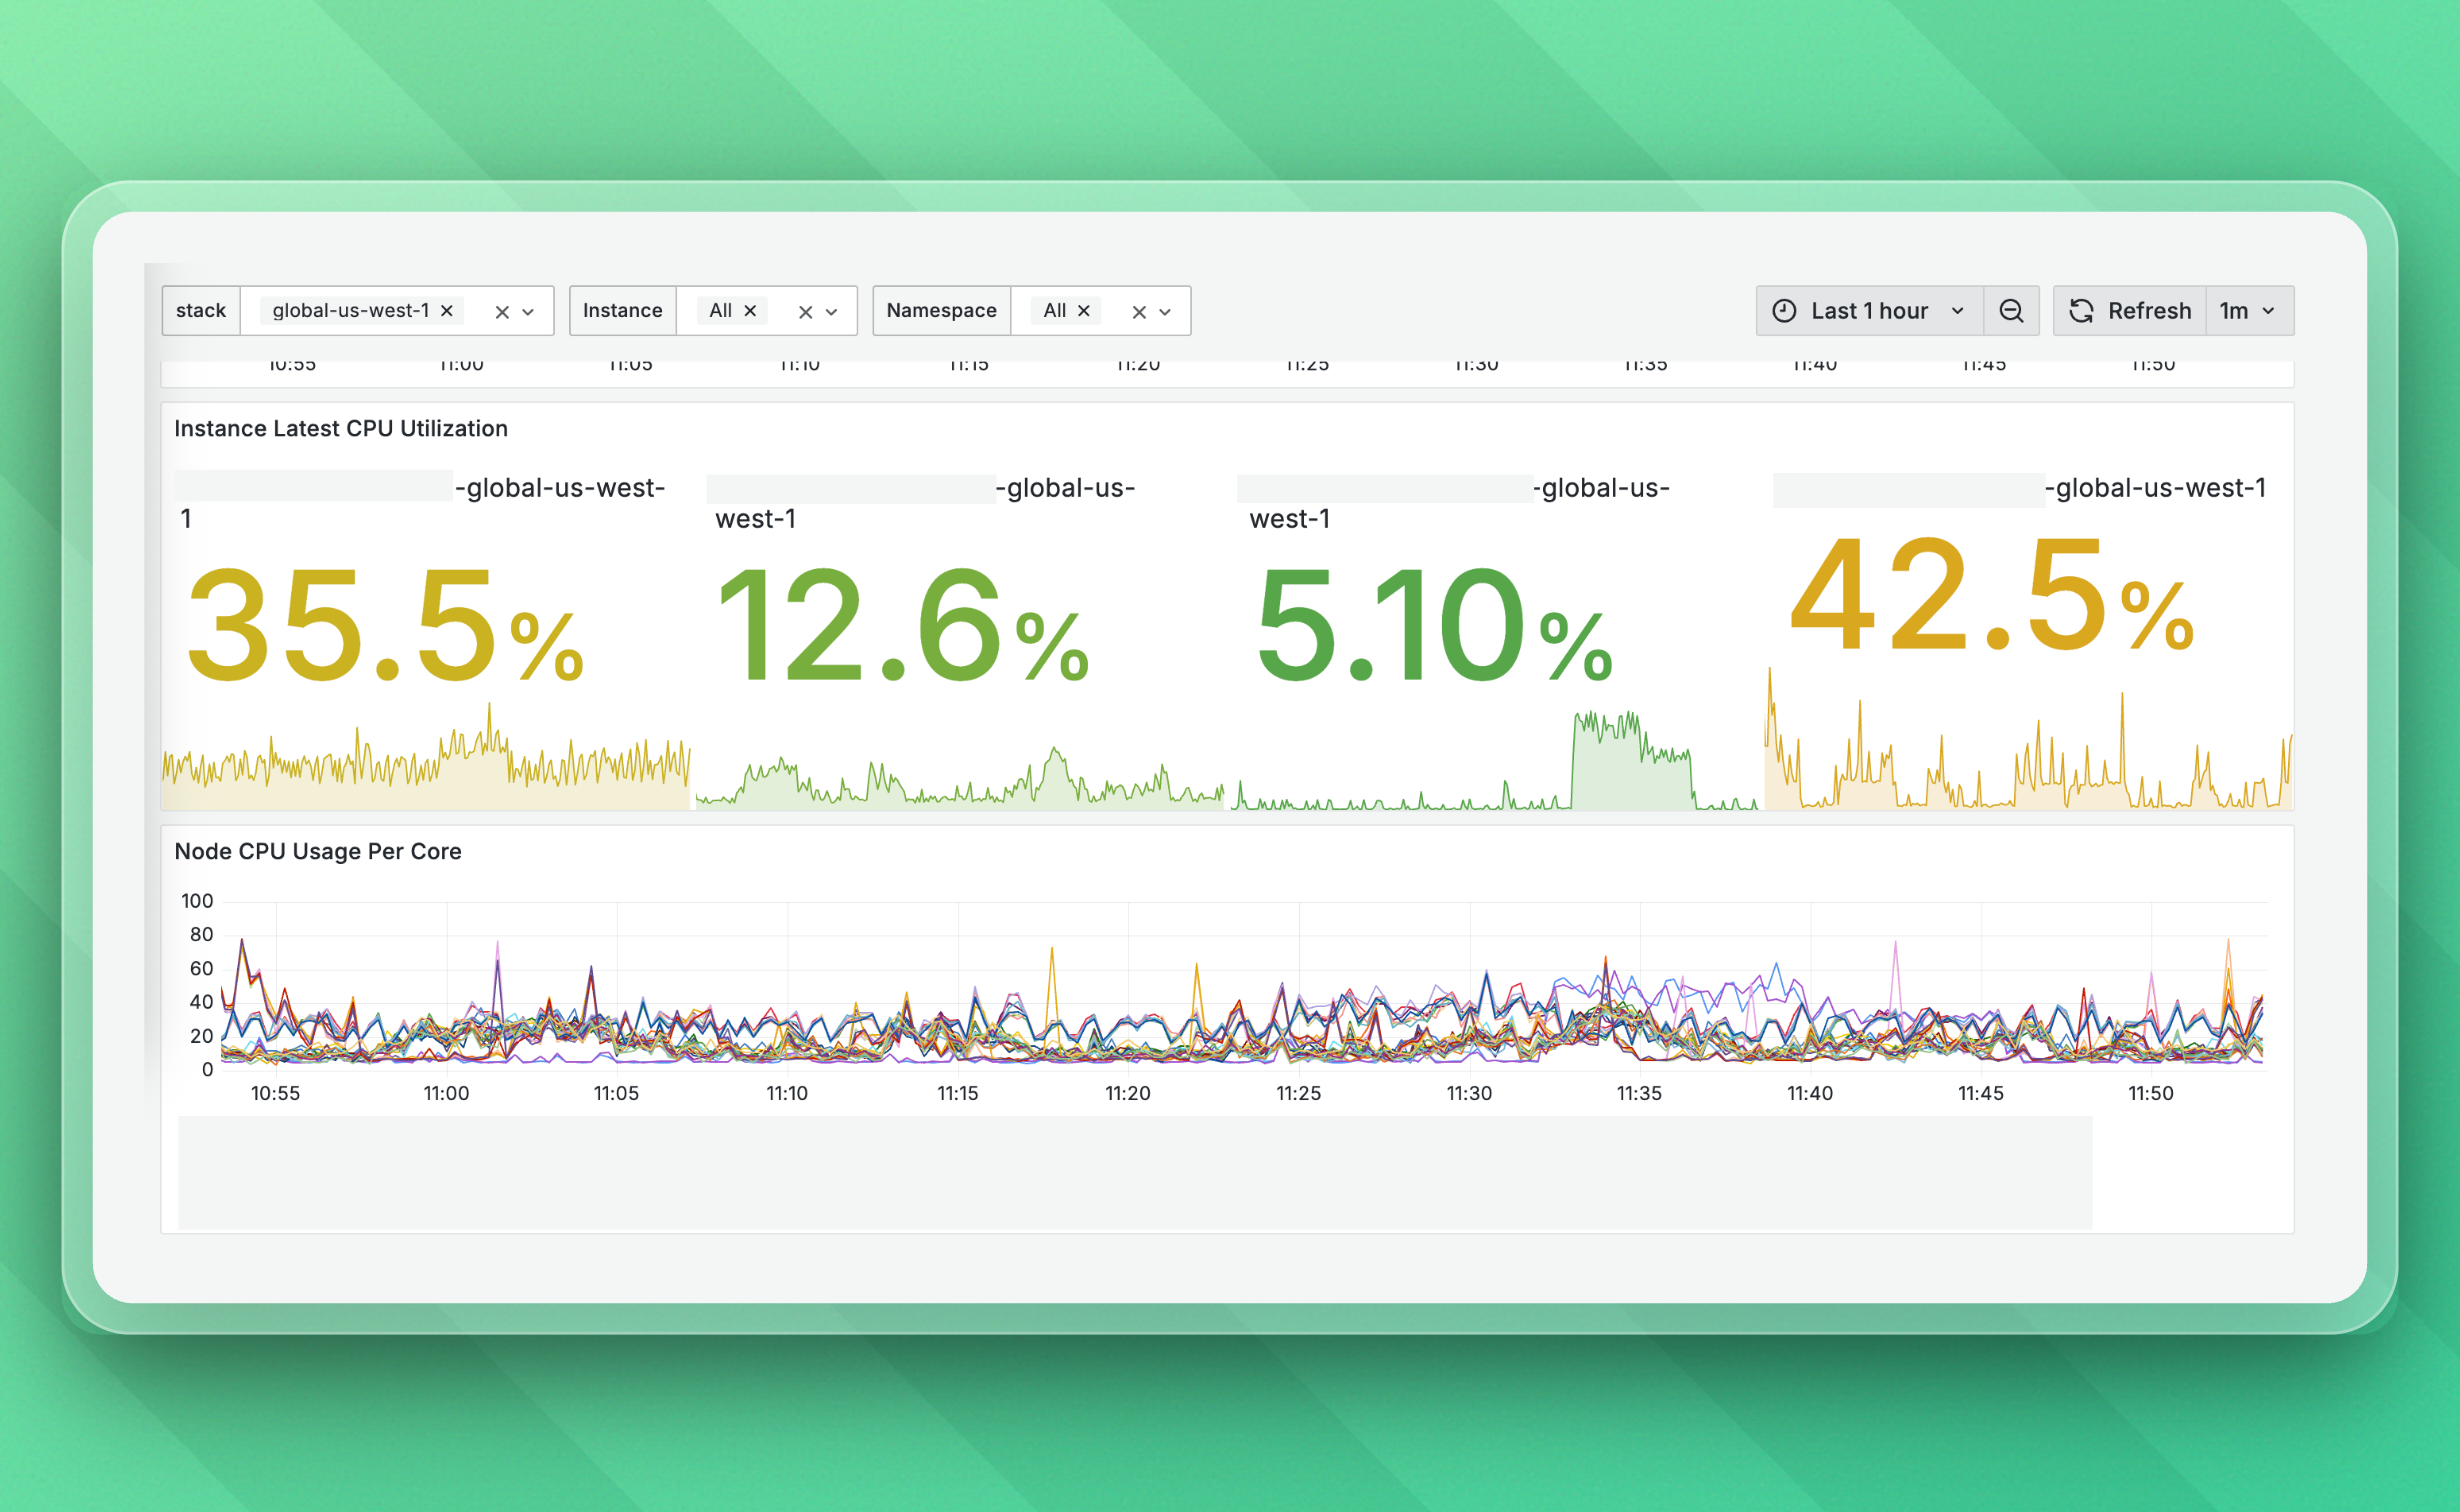
For example, this is what one of our simple Grafana dashboards (more on this later) looks like:

In this article, we'll take an in-depth look at the observability stack we've built over the past years. It allows us to scale our core product (Upstash Redis) up to 200+ billion monthly requests.
Because we're a small team, our monitoring has to fulfill three requirements:
- Support our scale (25+ clusters, globally distributed)
- Enable fast incident responses
- Give us peace of mind to ship updates confidently
How We Scale Upstash
I'm in the Site Reliability Engineering (SRE) team. Our job is to make sure the services our core team develops (the actual Redis, QStash, etc. implementations) are deployed securely and run extremely reliably.
Reliability is the foundation you need for any kind of scaling.
When I joined Upstash a few years ago, I was the second SRE team member and fifth engineer overall. But even though we started Upstash with an SRE team of just two people, we already had experience running enterprise-scale clusters and incident response at companies like Hazelcast, Atlassian, and Opsgenie.
They were far into their company journey when we joined those large enterprises. At Upstash, there was a big difference: we're now building a company from the beginning.
It's on us to make fundamental decisions that lay the foundation for all SRE operations for the future. We understood that real-time monitoring is the basis for reliable services. So we approached our monitoring system as a first-class priority, not an afterthought.
1. Prometheus
Because we use Kubernetes for deployment, Prometheus was our natural choice for collecting time-series metrics. We're running each cluster on its own Prometheus instance to continually scrape system and application metrics.
Using those metrics, a tool called Alertmanager deduplicates, groups, and routes alerts to our email and OpsGenie if it detects errors or problematic cluster behavior.
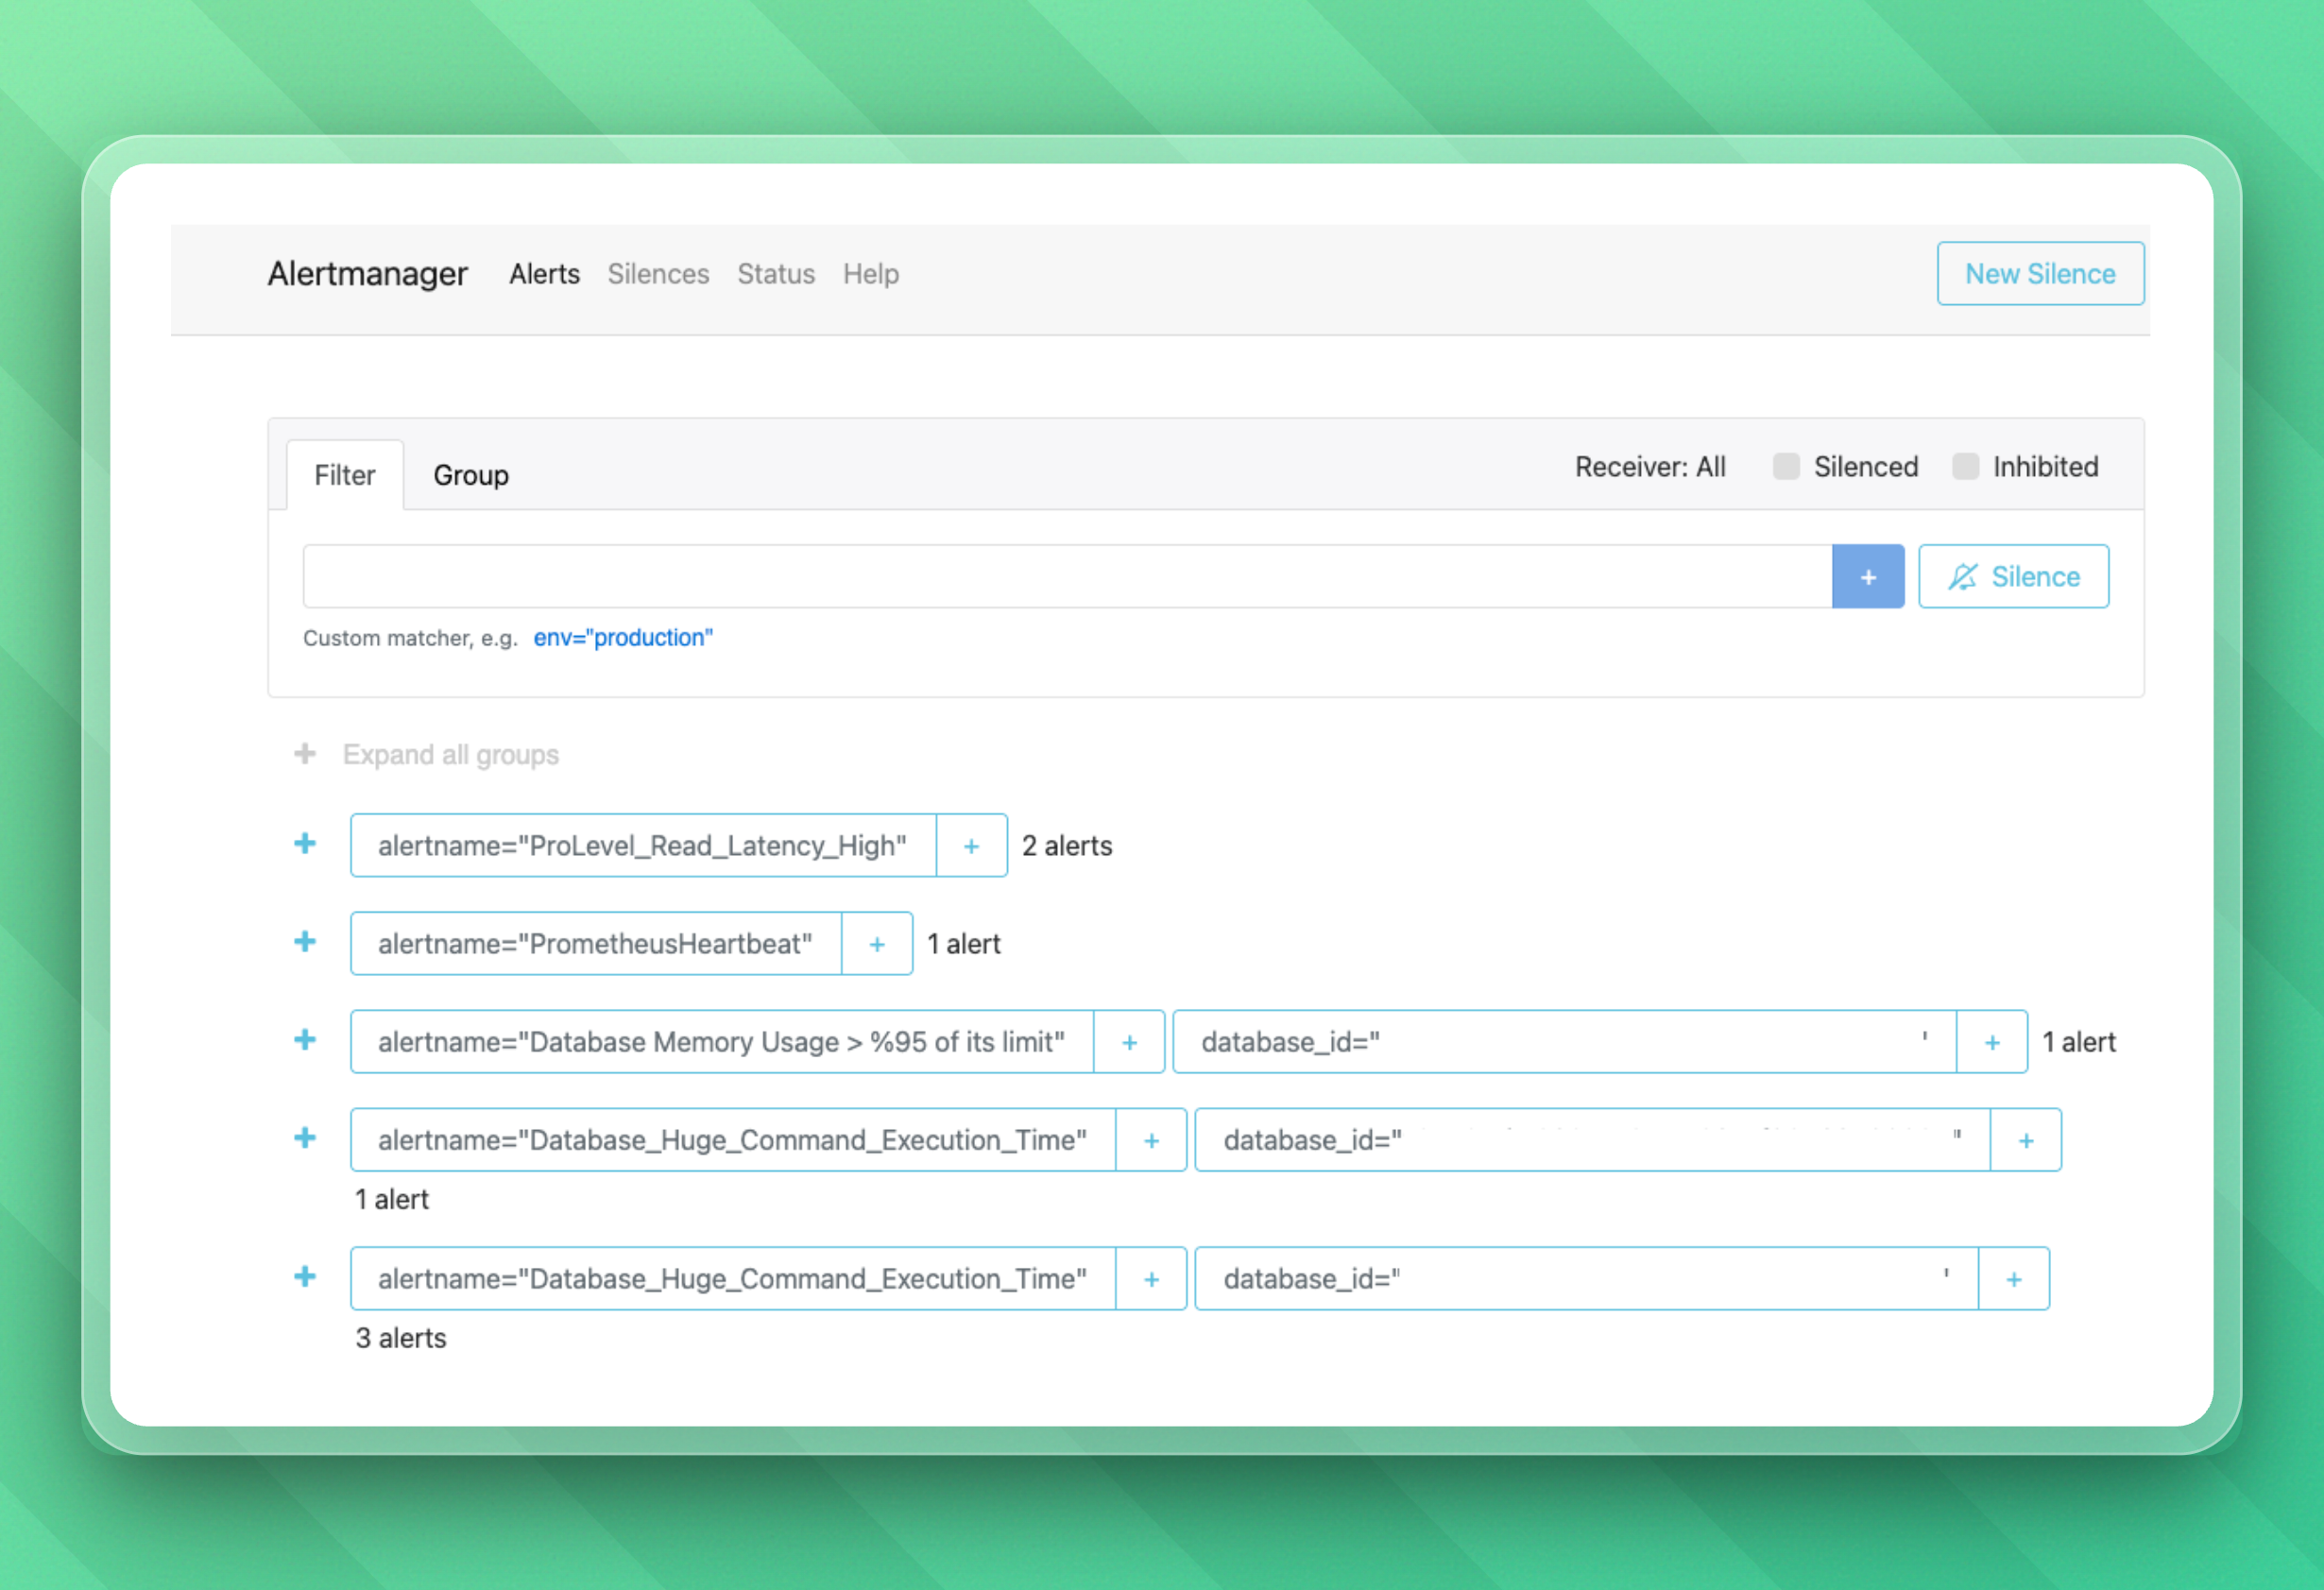
To give you an idea, here's what our alerts look like:

As a side note: If alerts weren't grouped and there'd be a large outage, we might get hundreds to thousands of alerts simultaneously. That's not just spam; it would distract us from finding the core problem.
At this point, we've developed a standardized set of alert rules we apply to Alertmanager across all clusters. This standardization means we can detect failure patterns regardless of cloud provider or region and it's making our life a lot easier.
2. Federation for Clear, Actionable Data
Early on, one of our most impactful decisions was to build Prometheus federation into our architecture.
Each Prometheus instance in a cluster exports application metrics to a central Prometheus instance. This pattern gives us a global view across all clusters and tenants, so it's simple to:
- Query metrics across multiple clusters
- Compare performance across regions
- Overview metrics and alerts in a single, centralized dashboard
- Stay focused during incident response
This is especially important because we run a multi-tenant architecture. Latency issues or errors might initially affect just one tenant in one cluster. But by having clear visibility into the big picture of how our clusters are doing, we can detect trends and correlate behaviors to act on minor issues before they become larger outages.
3. Custom Exporters to Scale Metric Collection
As clusters grow, so does the volume of metrics. Every Prometheus instance has a memory and disk footprint proportional to the number of time series it tracks. In high-traffic clusters, running an in-cluster Prometheus just for application metrics became more and more expensive.
To solve this, we built a custom exporter that acts like a Prometheus endpoint but doesn't actually store metrics. Instead, it reverse proxies metrics to the central Prometheus, which scrapes them directly.
With this architecture, we offload processing from large clusters while preserving federation and visibility. It's a simple but very powerful way to scale efficiently.
4. Metamonitoring for Monitoring the Monitors
It's not enough to monitor the clusters - we also need to monitor the monitoring stack itself.
To do this, we make every Prometheus instance send heartbeat signals to Opsgenie at regular intervals. If a Prometheus instance goes down, we're alerted within seconds. Even though monitoring the monitors might sound ridiculous, it allows us to make sure that our observability stack is just as reliable as the clusters they monitor.
5. On-Call Rotations for Fast Incident Responses
All of this monitoring feeds into one critical process: incident response.
We run a 24/7 on-call rotation with both a primary and a backup responder at all times. If the primary responder doesn't acknowledge an alert within minutes, the backup person is notified immediately. Alerts are sent through Slack and Opsgenie for maximum visibility.
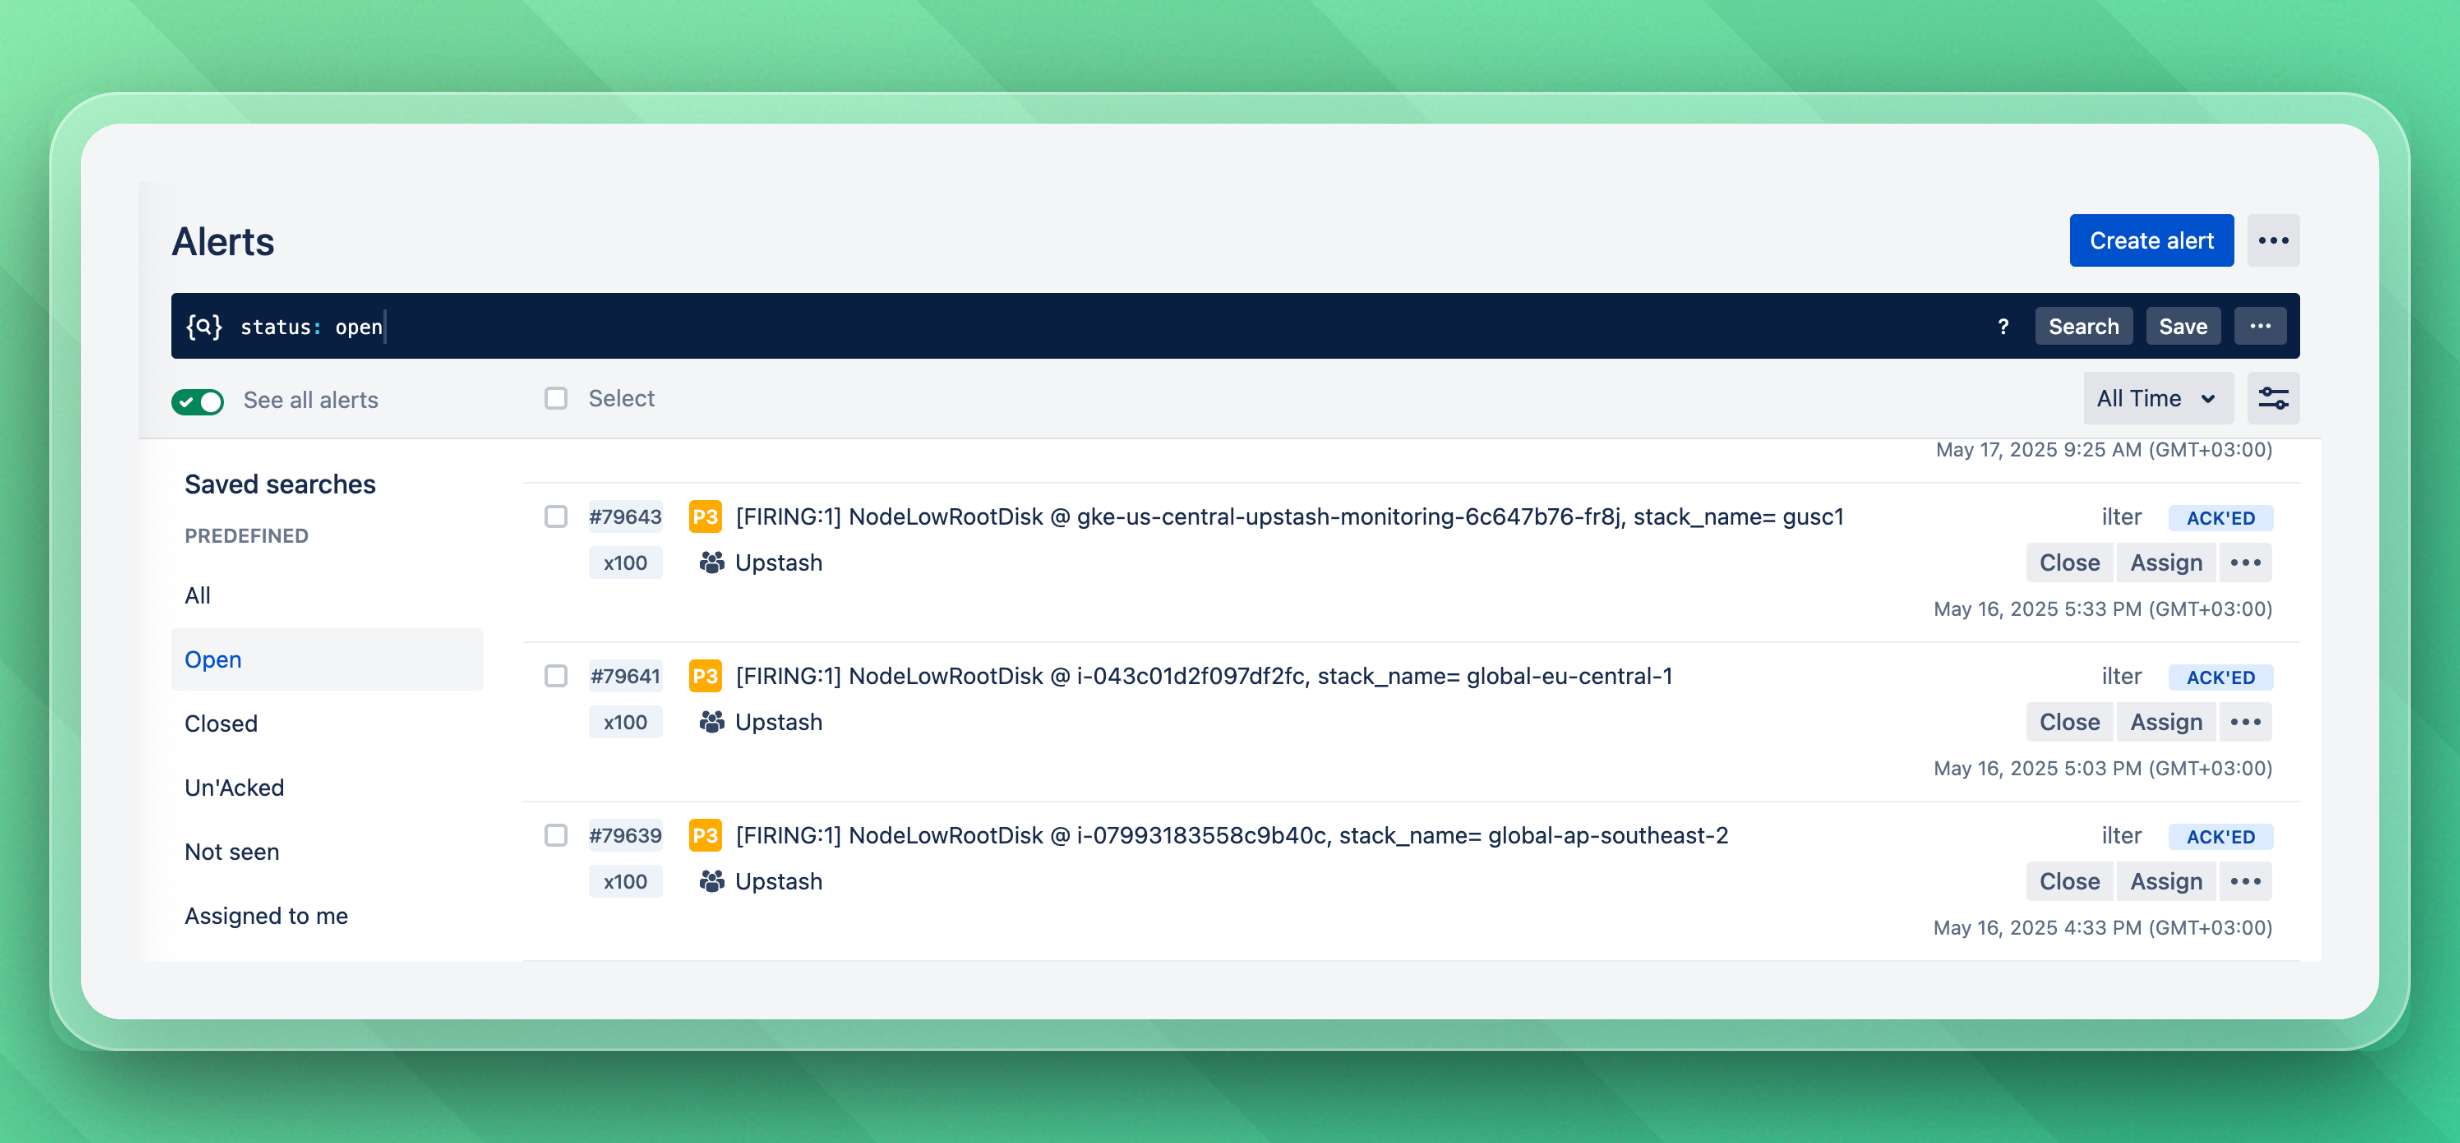
Here's what Opsgenie looks like:

Because all alerts are built on top of clean, predictable, and actionable data, we always have a clear starting point for incident response and make it easy for ourselves to find the problem fast. Another great benefit of these clear insights and templated alerts is that they simplify onboarding new SRE engineers onto our team.
6. Teleport for Incident Collaboration
We use Teleport for secure, role-based access to our production environments. During incidents, it's sometimes helpful to collaborate with other teams, like our core software engineers working on product implementations.
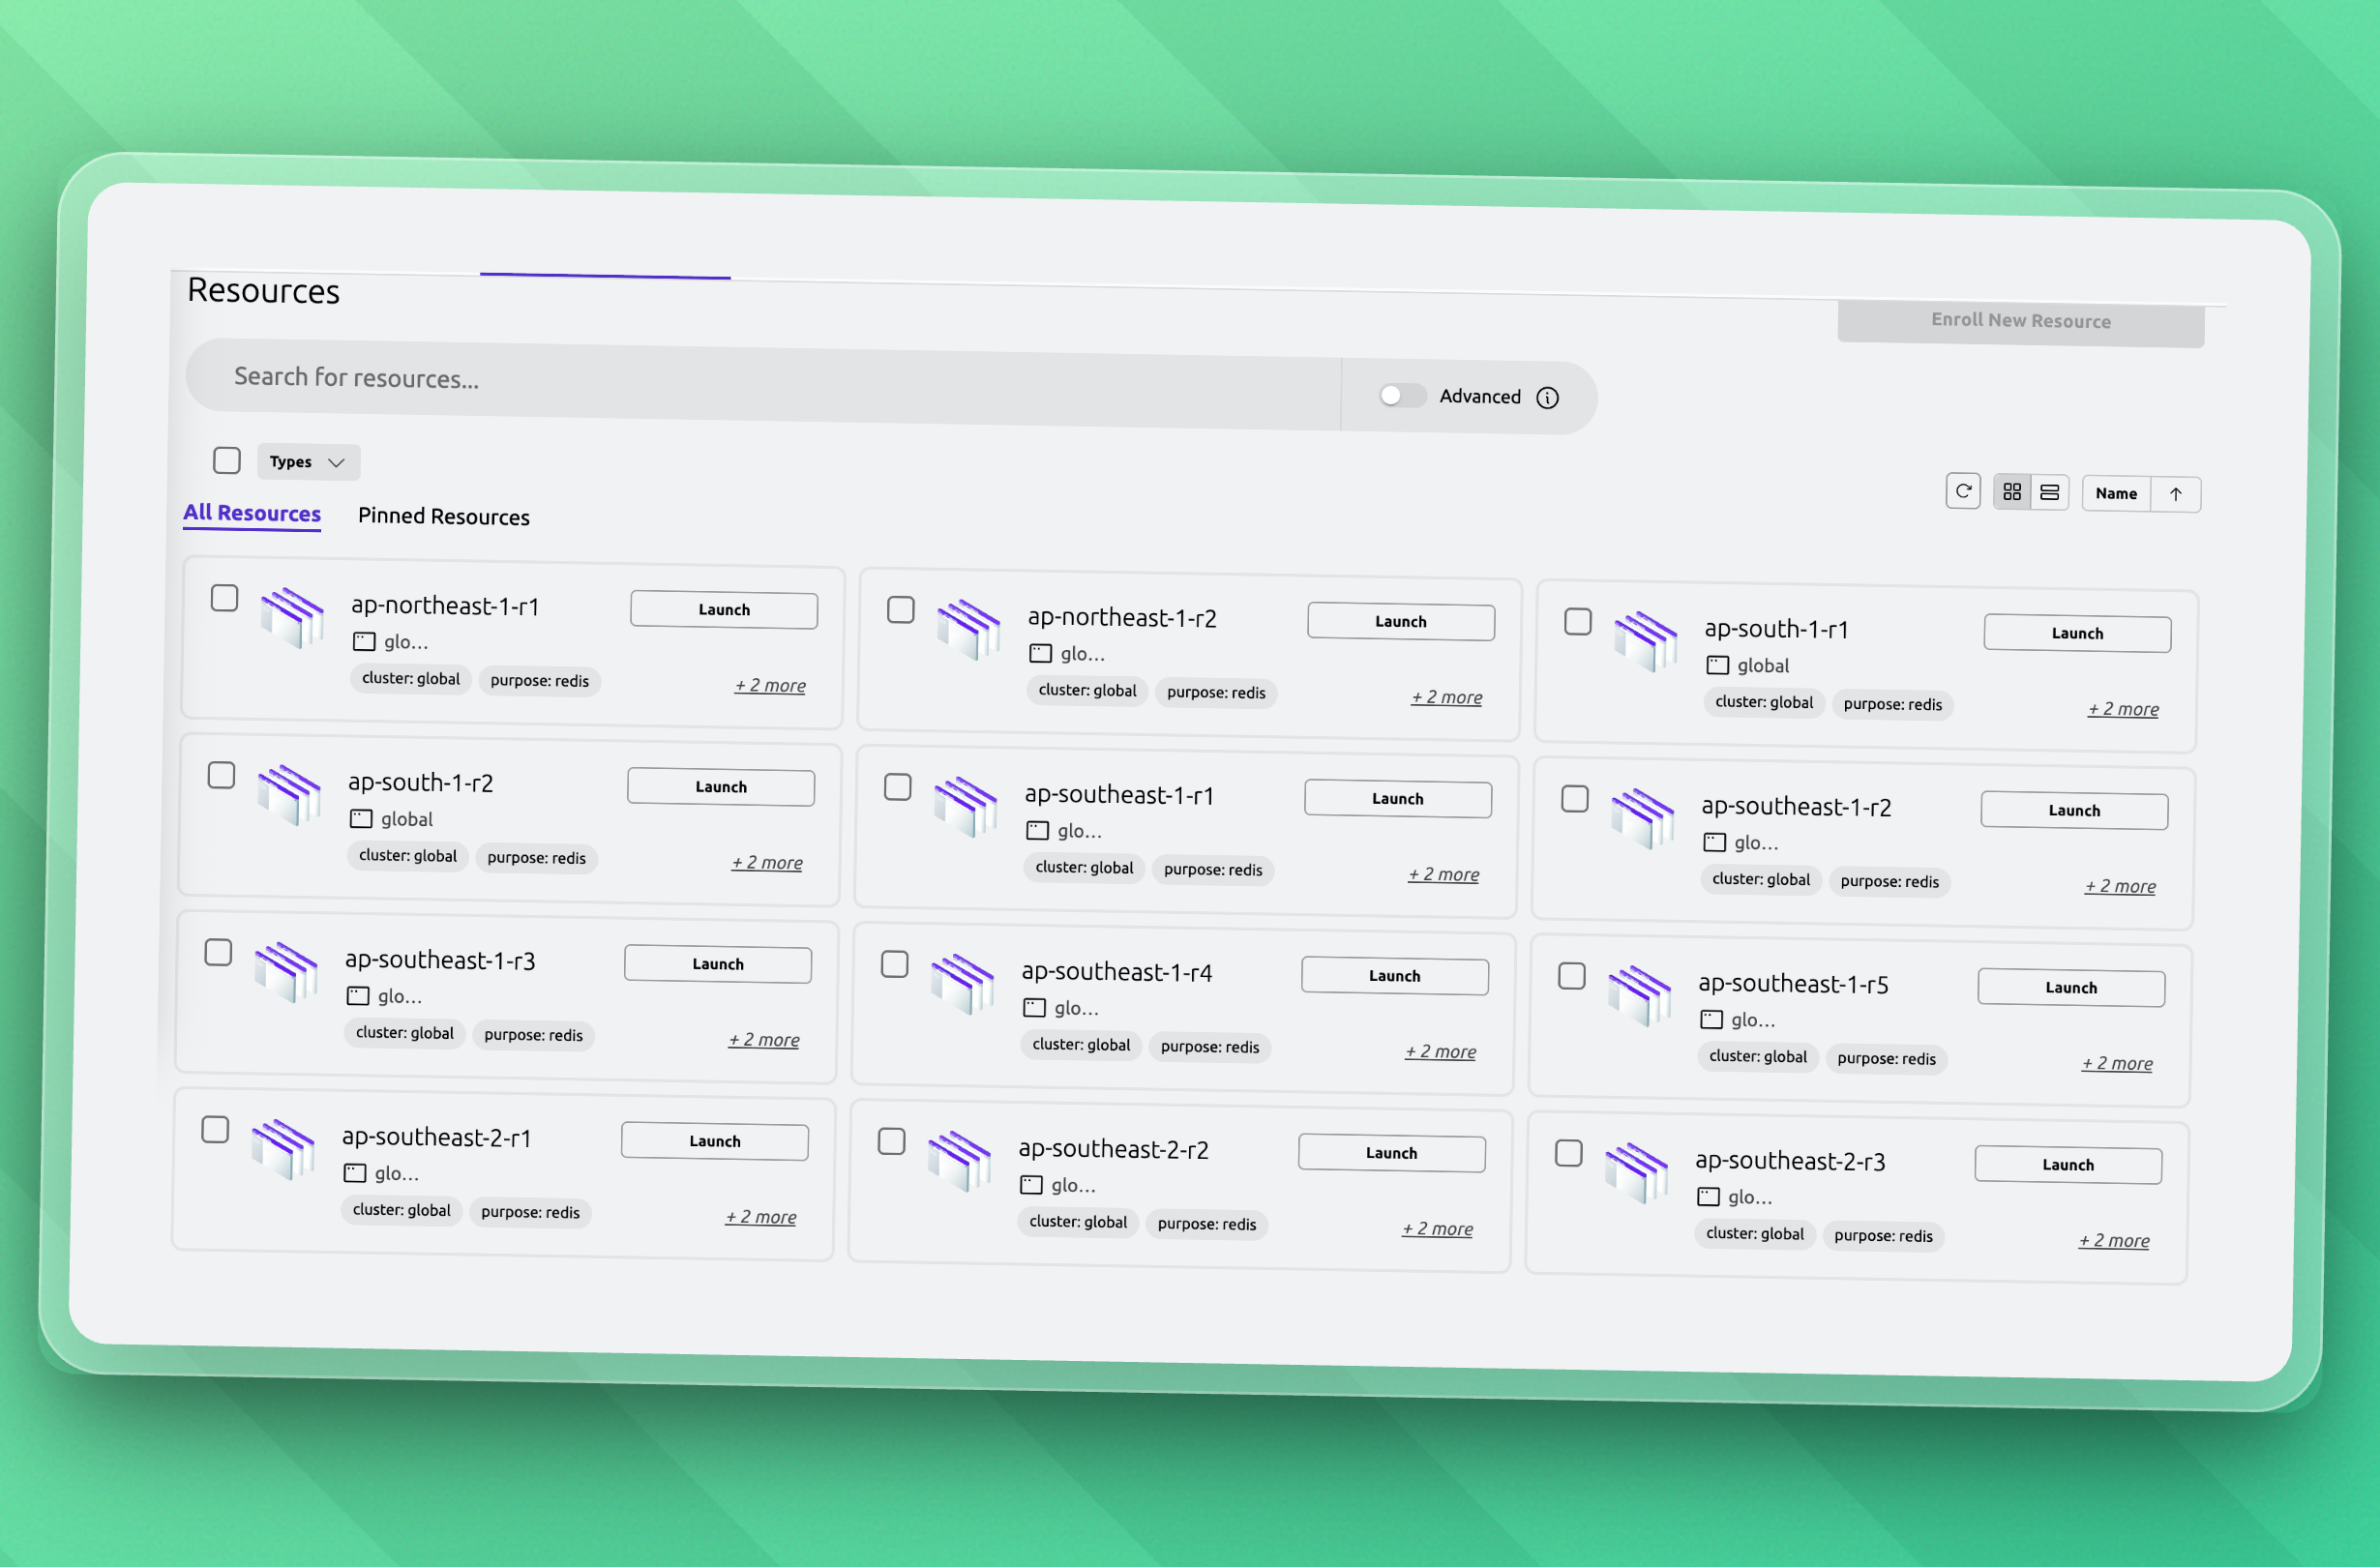
We can see every region in our Teleport dashboard:

With Teleport's auditable, granular, just-in-time access controls, we can assign the minimum necessary permissions for each person or team involved in the incident response. This is also called the "principle of least privilege". This setup allows us to move extremely fast during incidents and keep security a top priority.
7. Thanos for Long-Term Monitoring
While application metrics are sent to a central Prometheus for real-time aggregation and alerting, we use Thanos to aggregate and store infrastructure-level metrics such as node health, system usage, and cluster performance across all clusters.
We don't need these metrics in our complex cross-cluster application queries, so we intentionally exclude them from central Prometheus to reduce its resource usage. Instead, Thanos gives us:
- Cross-cluster visibility into infrastructure health
- Long-term retention for historical comparisons
- A way to debug slow-moving or hidden infrastructure issues
8. Humio for Centralized Logging
Metrics tell us when something is wrong, logs tell us why.
To complement our Prometheus-based monitoring, we collect logs from every application across all clusters and send them to Humio for centralized storage and analysis.
In Humio, we've set up:
- Alert rules that scan logs for error patterns, anomalies, or specific failure conditions
- Slack and Opsgenie integrations to notify our team when critical log-based alerts fire
- Dashboards that aggregate logs by service, tenant, or cluster to give us real-time insights into application behavior
Humio allows us to move fast during an incident response. We often find helpful answers before the metrics even update.
9. Falco and eBPF for Security
Clear metrics and logs help us provide performance and reliability. But we also need visibility into runtime security events, especially at the network and kernel level.
To monitor for malicious behavior and suspicious access patterns, we use Falco, a powerful open-source runtime security tool built on eBPF. Falco monitors connections to our services and generates structured logs for suspicious behavior, for example:
- processes opening suspicious outbound network connections
- containers spawning shells or trying to modify sensitive files
We send all Falco logs to a central observability cluster where we've deployed an Elasticsearch instance. This gives us:
- Near real-time insight into potentially malicious connections
- A way to correlate security signals across services and regions
- The ability to act fast and block sources before damage is done
Detecting malicious activity isn't always easy because it can be unpredictable. But this setup lets us know about anomalous behavior near instantly and with (very) minimal false positives. Thanks to eBPF, we achieve all of this with minimal performance overhead even at scale.
10. UpstashBot: A Custom Internal Tool
To reduce friction during incidents and improve collaboration, we developed UpstashBot, an internal Slack tool that helps with monitoring and incident responses.
We can use UpstashBot to:
- Query metrics or check dashboards directly from Slack
- Pull real-time status reports for services or tenants
- Investigate problems without jumping between tools
- Start pre-defined incident workflows
UpstashBot isn't just for SREs. It allows core software engineers and other team members to contribute to an incident response with granular access permissions. We’ve integrated role-based controls so users can only access the data and actions appropriate for their role, all directly from our Slack. UpstashBot's payoff exceeds the development effort by a lot. Especially during high-pressure events, knowing we can ask for help from anyone in the team and get them hands-on in seconds is incredibly reassuring.
Why This Architecture Matters
We're a multi-cloud, multi-region, multi-tenant platform. That's a lot of "multi's". We're able to manage this as a small, focused SRE team because our observability system is:
- Centralized and cross-cluster for visibility
- Federated for scale
- Secure by design
- Efficient in resource usage
- Optimized for incident response speed
- And standardized for ease of use
This observability stack is not just a technical layer, it’s how we scale our services like Redis and QStash, manage on-call effectively, and keep our reliability promise to customers.
Final Thoughts
For us, monitoring isn’t just about metrics. It's about keeping our promise and scaling confidently. By making observability a first-class citizen in our architecture from day one (e.g. with Prometheus, federation, Thanos, Humio, Falco, Teleport, and Upstashbot), we've built a monitoring system that supports our products, our customers, and our engineers.
It allows us to respond quickly and sleep well at night. Even with 25+ clusters running around the globe.
If you're building a distributed platform yourself, here's my advice: invest in observability early. Your future self (and your on-call team) will thank you.
