> ## Documentation Index
> Fetch the complete documentation index at: https://upstash.com/docs/llms.txt
> Use this file to discover all available pages before exploring further.
# Prometheus - Upstash Redis Integration
To monitor your Upstash database in Prometheus and visualize metrics in Grafana, follow these steps:
**Integration Scope**
Upstash Prometheus Integration only covers Pro databases or those included in the Enterprise Plan.
## **Step 1: Log in to Your Upstash Account**
1. Open your web browser and navigate to [Upstash](https://console.upstash.com/).
2. Navigate to the main dashboard, where you’ll see a list of your databases.
## **Step 2: Select your Database**
1. Select the database you want to integrate with Prometheus.
2. This will open the database settings, where you can manage various configuration options for your selected database.
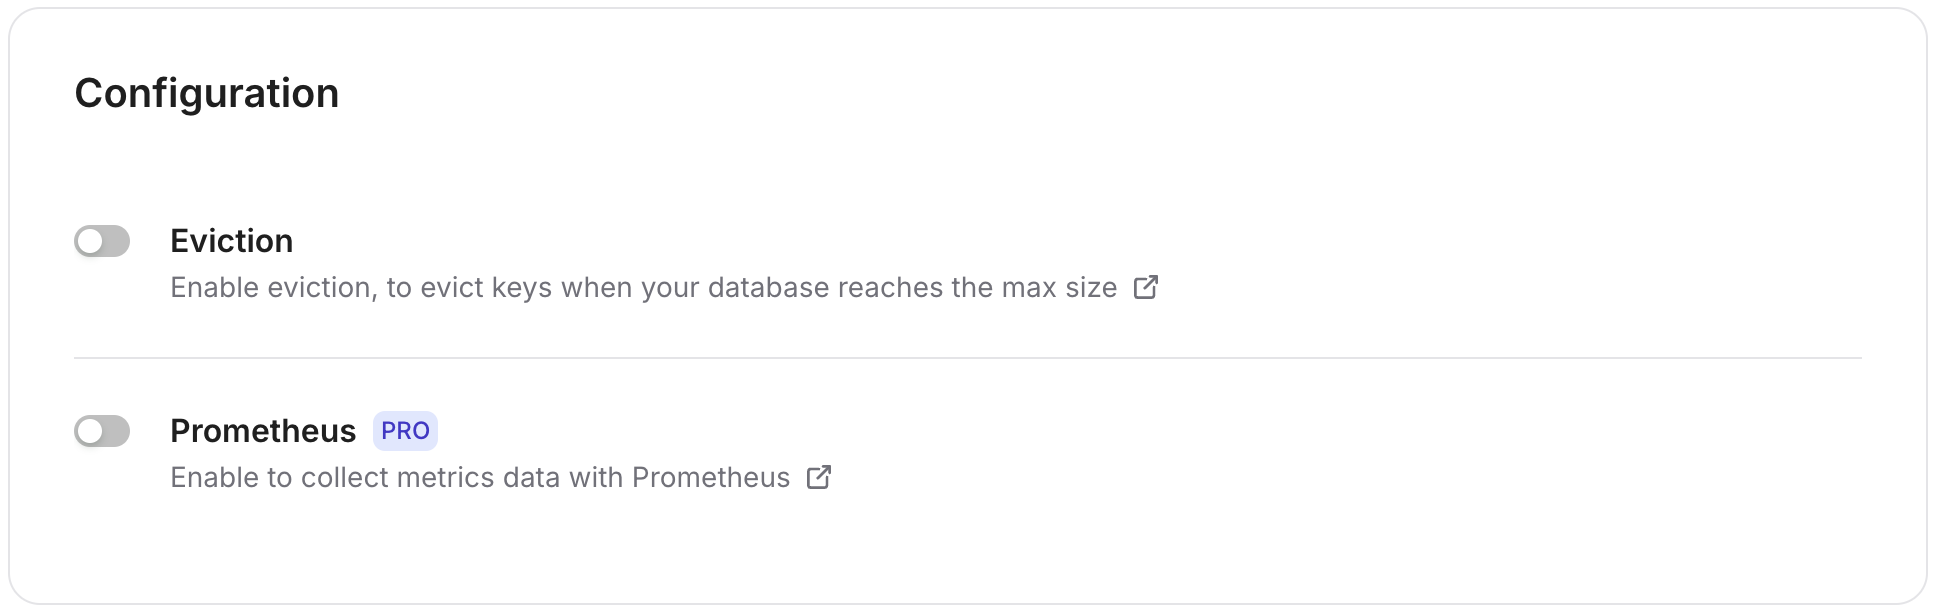 3. Enable Prometheus by toggling the switch. This allows you to monitor metrics related to your Upstash database performance, usage, and other key metrics.
## **Step 3: Connect Accounts**
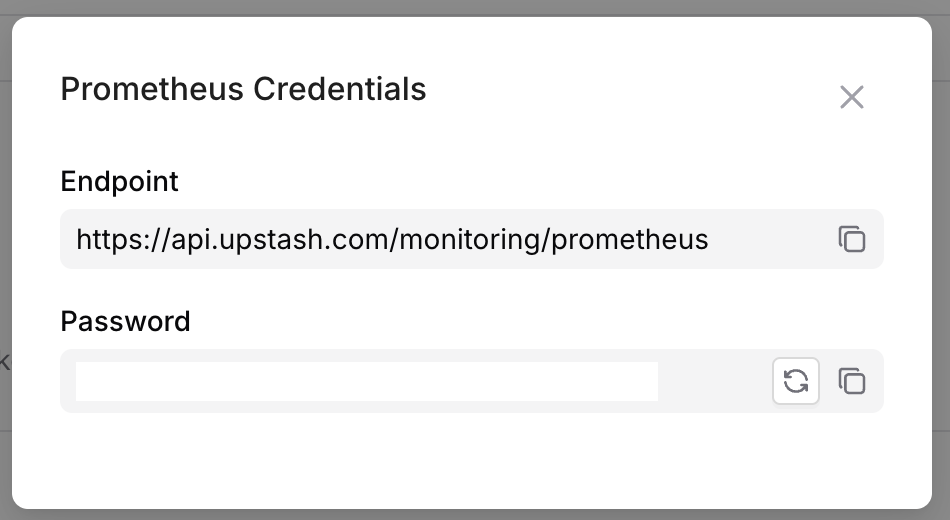
1. After enabling Prometheus, a monitoring token is generated and displayed.
2. Copy this token. This token is unique to your database and is required to authenticate Prometheus with the Upstash metrics endpoint.
**Header Format**
You should add monitoring token according to this format `Bearer `
3. Enable Prometheus by toggling the switch. This allows you to monitor metrics related to your Upstash database performance, usage, and other key metrics.
## **Step 3: Connect Accounts**
1. After enabling Prometheus, a monitoring token is generated and displayed.
2. Copy this token. This token is unique to your database and is required to authenticate Prometheus with the Upstash metrics endpoint.
**Header Format**
You should add monitoring token according to this format `Bearer `
 ## **Step 4: Set Up Prometheus Connection**
### **Grafana Dashboard Setup**
1. Open your Grafana instance, navigate to the Data Sources section, and select Prometheus as the data source.
## **Step 4: Set Up Prometheus Connection**
### **Grafana Dashboard Setup**
1. Open your Grafana instance, navigate to the Data Sources section, and select Prometheus as the data source.
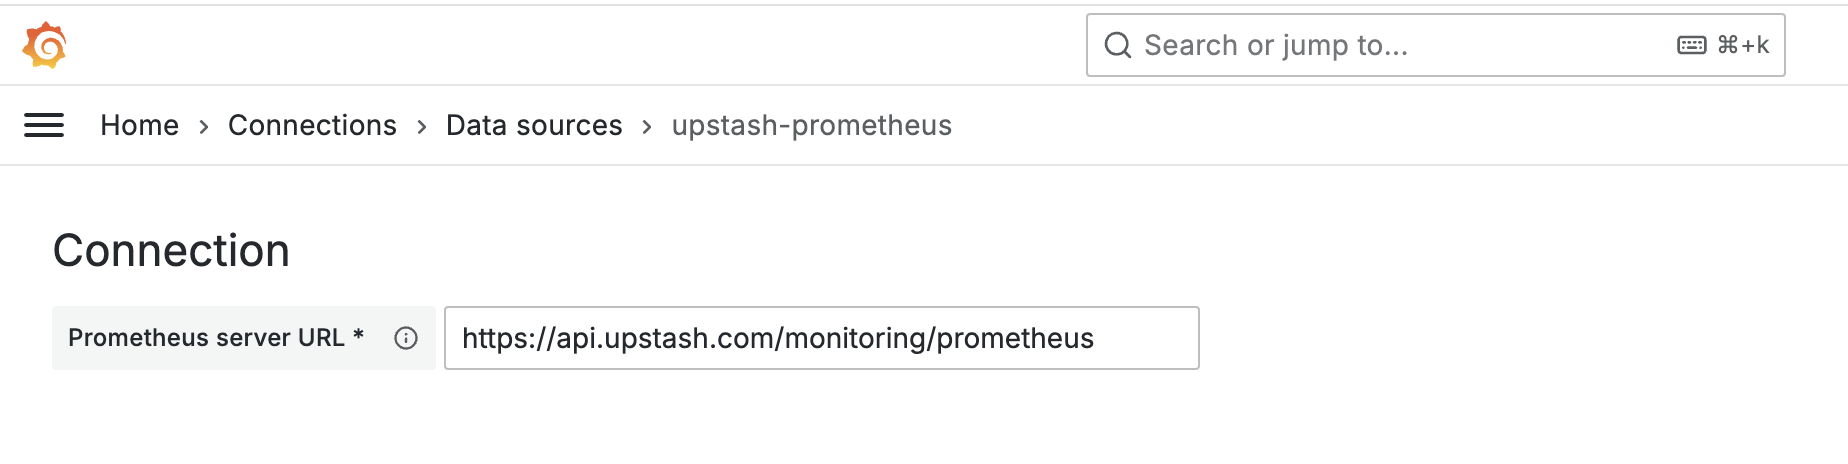 2. Enter the data source name, set `https://api.upstash.com/monitoring/prometheus` as the data source address, and then add your monitoring token in the HTTP Headers section.
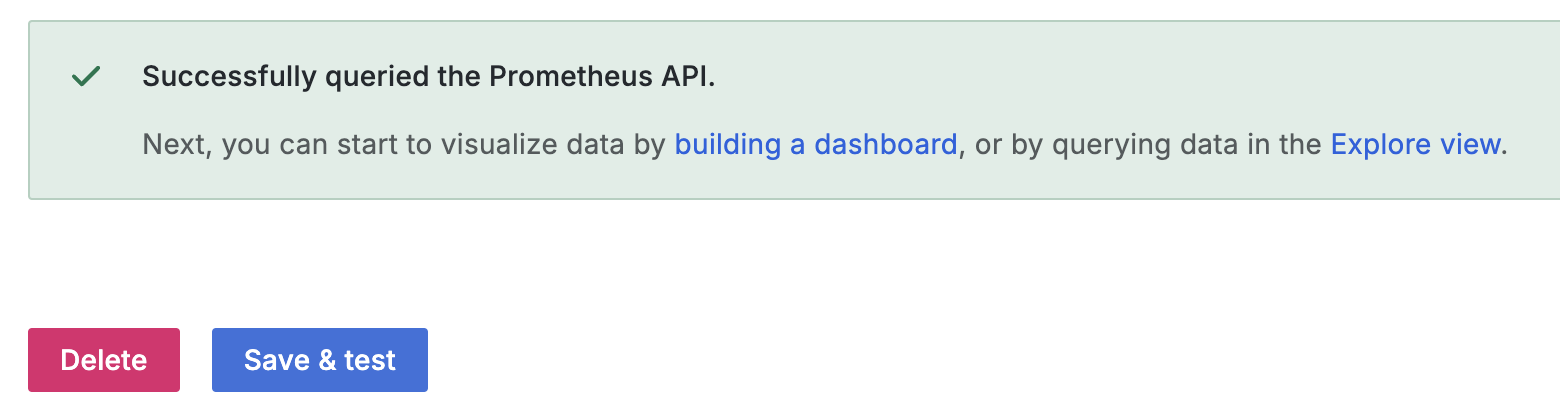
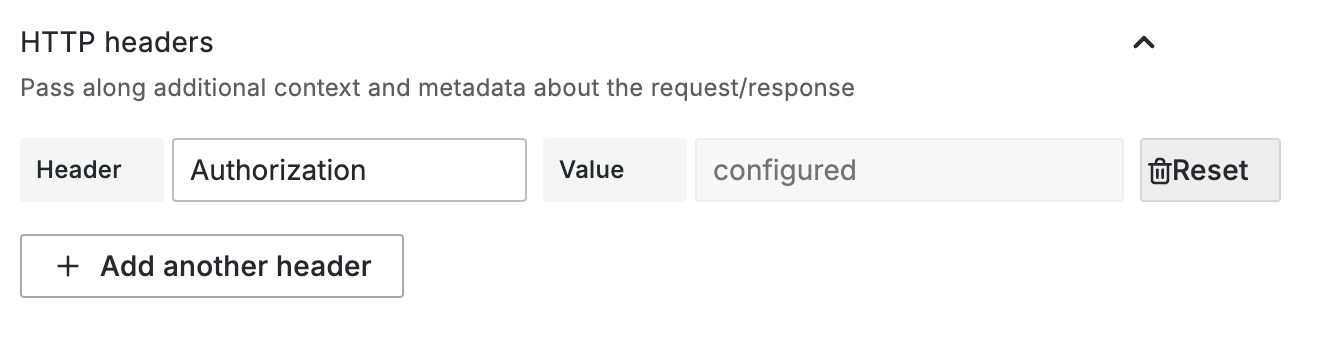 3. Then, click Test and Save to verify that the data source is working properly.
 ### **Prometheus Federation Setup**
Federation lets your Prometheus pull metrics from Upstash’s API and store them in **your own** Prometheus instance, so Grafana can query your Prometheus instead of hitting the Upstash endpoint directly.
#### When to use federation
* You already run Prometheus and want to persist Upstash metrics locally.
* You want to control retention, recording rules, or alerts on Upstash metrics
1. Set up a new scrape job in your Prometheus configuration file (`prometheus.yml`):
```yaml theme={"system"}
scrape_configs:
# Federation job: pull from Upstash API
- job_name: "federate_upstash"
honor_labels: true
metrics_path: "/monitoring/prometheus/federate"
scheme: https
params:
match[]:
- 'upstash_db_metrics{}'
static_configs:
- targets:
- "api.upstash.com"
authorization:
type: Bearer
credentials: ""
```
This configuration assumes you want to pull all metrics. You can adjust the `match[]` parameter to filter specific metrics if needed.
* `upstash_db_metrics{database_id="your_database_id"}` can be used to pull metrics for a specific database
* `upstash_db_metrics{replica_id=~"us-east-1.*"}` can be used to pull metrics for replicas in a specific region
2. Verify the Federation Target
* Reload (or restart) your Prometheus server to apply the new configuration.
* Visit **Prometheus → Status → Targets** and confirm `federate_upstash` is **UP**
## **Step 5: Wait for Metrics Availability**
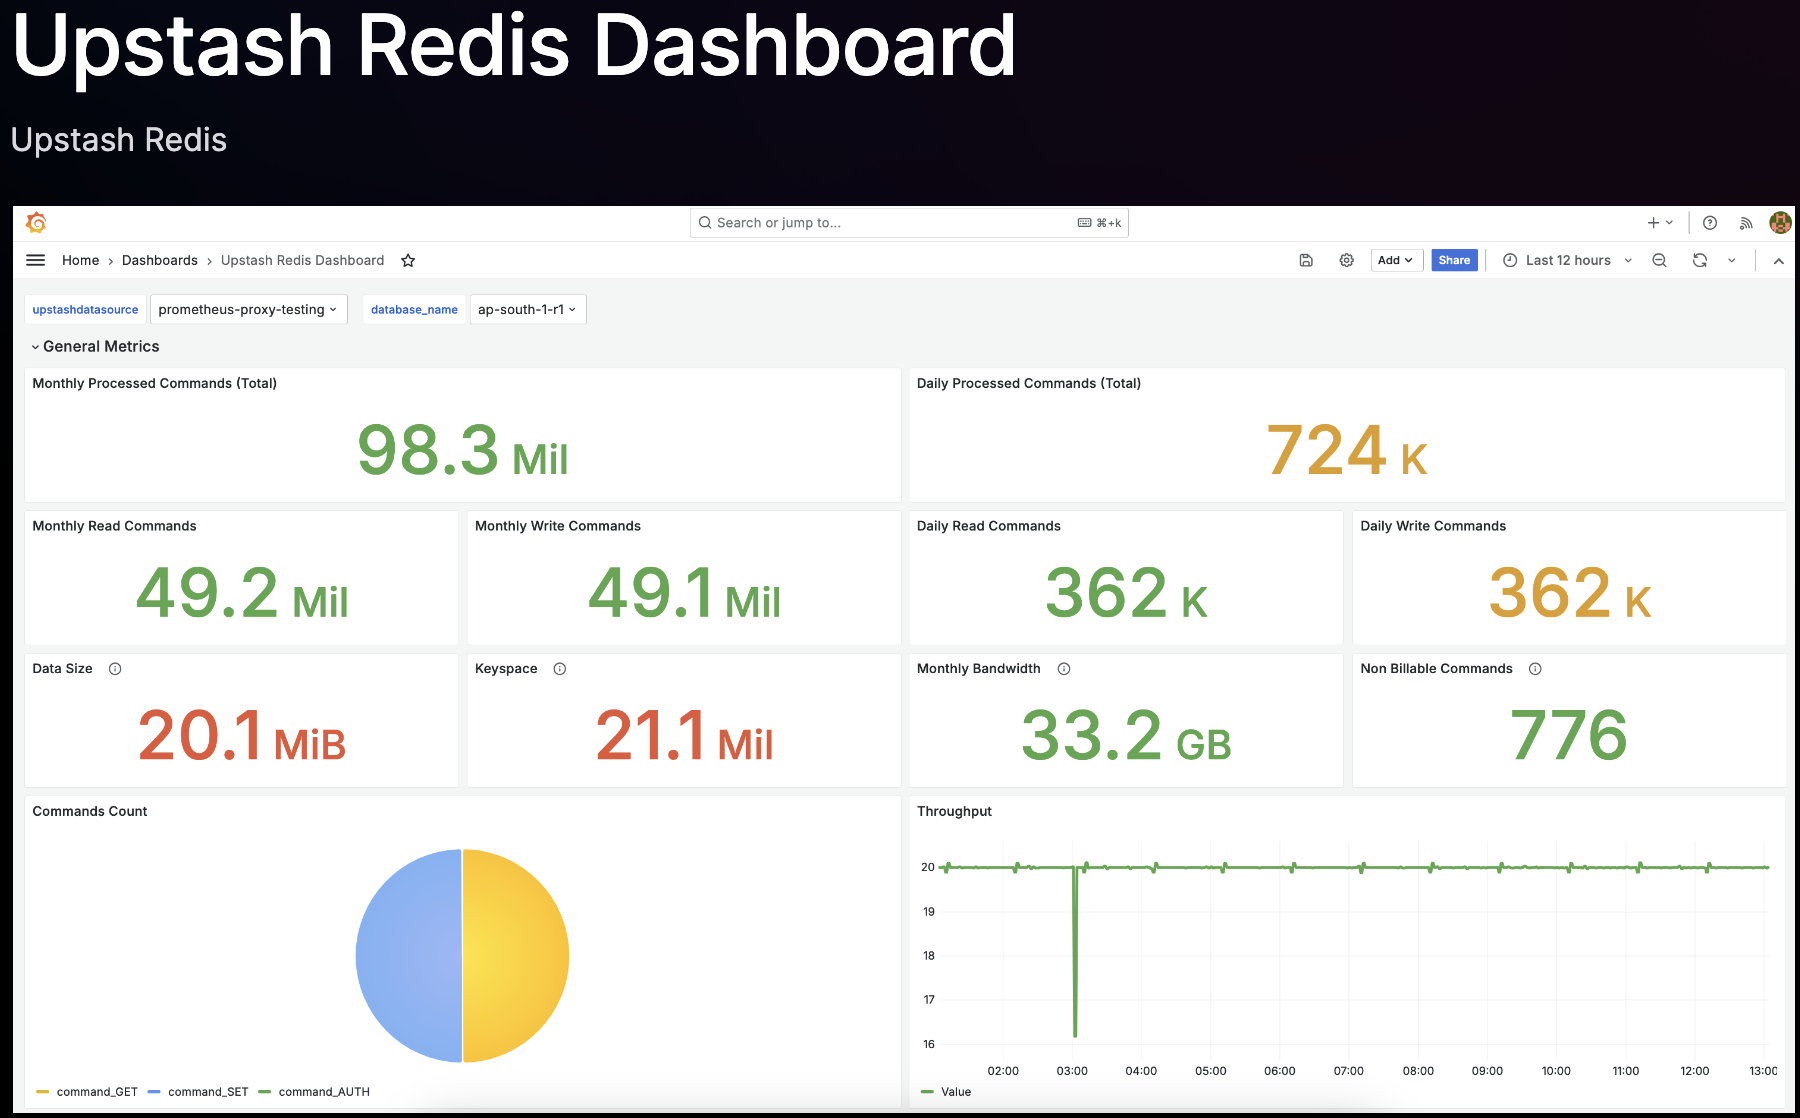
To visualize your Upstash metrics, you can use a pre-built Grafana dashboard.
Select your Prometheus data source when prompted, and complete the import.
Please check this address to access Upstash Grafana Dashboard Dashboard
### **Prometheus Federation Setup**
Federation lets your Prometheus pull metrics from Upstash’s API and store them in **your own** Prometheus instance, so Grafana can query your Prometheus instead of hitting the Upstash endpoint directly.
#### When to use federation
* You already run Prometheus and want to persist Upstash metrics locally.
* You want to control retention, recording rules, or alerts on Upstash metrics
1. Set up a new scrape job in your Prometheus configuration file (`prometheus.yml`):
```yaml theme={"system"}
scrape_configs:
# Federation job: pull from Upstash API
- job_name: "federate_upstash"
honor_labels: true
metrics_path: "/monitoring/prometheus/federate"
scheme: https
params:
match[]:
- 'upstash_db_metrics{}'
static_configs:
- targets:
- "api.upstash.com"
authorization:
type: Bearer
credentials: ""
```
This configuration assumes you want to pull all metrics. You can adjust the `match[]` parameter to filter specific metrics if needed.
* `upstash_db_metrics{database_id="your_database_id"}` can be used to pull metrics for a specific database
* `upstash_db_metrics{replica_id=~"us-east-1.*"}` can be used to pull metrics for replicas in a specific region
2. Verify the Federation Target
* Reload (or restart) your Prometheus server to apply the new configuration.
* Visit **Prometheus → Status → Targets** and confirm `federate_upstash` is **UP**
## **Step 5: Wait for Metrics Availability**
To visualize your Upstash metrics, you can use a pre-built Grafana dashboard.
Select your Prometheus data source when prompted, and complete the import.
Please check this address to access Upstash Grafana Dashboard Dashboard
 ## **Conclusion**
You've now integrated your database with Upstash Prometheus, providing access to improved monitoring and analytics.
Feel free to explore Upstash's features and dashboards to gain deeper insights into your system's performance.
If you encounter any issues or have questions, please refer to the Upstash support documentation or contact our support team for assistance.
## **Conclusion**
You've now integrated your database with Upstash Prometheus, providing access to improved monitoring and analytics.
Feel free to explore Upstash's features and dashboards to gain deeper insights into your system's performance.
If you encounter any issues or have questions, please refer to the Upstash support documentation or contact our support team for assistance.