Docs7 vs. Mintlify: Page Speed Benchmark

We built Docs7, so you should not take our word for how fast it is. The Upstash and Context7 docs are live on both Docs7 and Mintlify, with the same content at the same paths. That makes a fair test easy, and we let Google PageSpeed Insights and DebugBear do the measuring.
We picked 17 pages and left out the easy ones. Plain text is fast anywhere, so these pages have screenshots, video, long API references, and custom components. Google tested every URL 10 times on mobile and 10 times on desktop, with the same settings for both hosts. All the numbers below are medians.
The results
Docs7 scored higher in 33 of 34 Google comparisons, and one was equal. Its average score was 80.1 vs. 58.9 on mobile and 94.9 vs. 88.4 on desktop. DebugBear also gave Docs7 the higher score on all 10 page pairs it tested, on both devices.
Single runs are noisier than medians. When we compare run by run, 340 pairs in total, Docs7 scored higher in 263, Mintlify in 66, and 11 were equal.
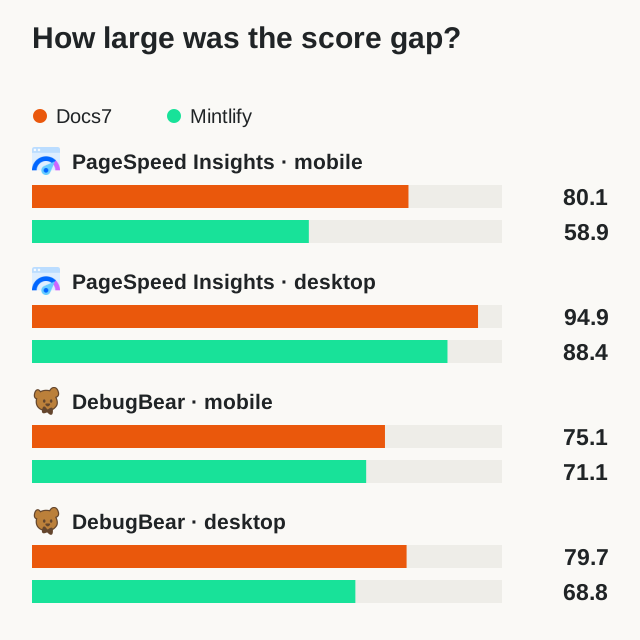
The difference is largest on mobile. The expandable API fields page scored 85 vs. 46.5, and the long CLI guide scored 89.5 vs. 54. It is smallest on desktop, where the release notes page had the same score on both hosts, 96.5, and two other pages were within one point.
Docs7 has slow pages too. The long API reference scored 57 on mobile. That is ahead of Mintlify's 46.5, but it is the lowest Docs7 score in the set.
What we tested
We used two documentation projects. Each one is available on both platforms:
We picked pages that stress different parts of a documentation site:
- Images and video test download cost and layout stability.
- Long API, SDK, and CLI references test large pages and code blocks.
- Tabs, steps, accordions, diagrams, a file tree, and a custom React component add rendering and JavaScript work.
The full results on GitHub list all 17 pairs, with links to both the Docs7 and Mintlify URLs in every row.
Results by page type
Each dot is the average of the page medians in that group, and the line between the two dots shows the difference. Scores are out of 100. Docs7 had the higher score in every group on both devices.
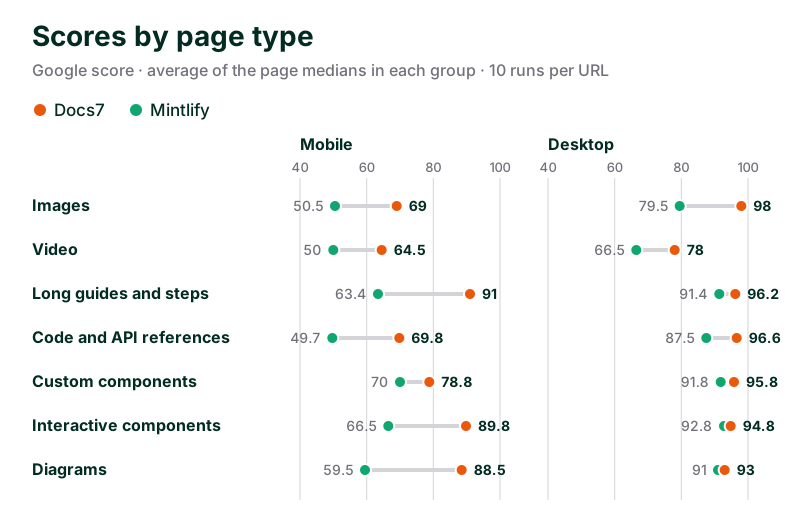
On mobile, the largest differences were on diagrams (88.5 vs. 59.5) and long guides (91 vs. 63.4). Pages with video were the slowest group for Docs7, at 64.5. On desktop, both hosts scored above 90 in most groups, and images made the largest difference, 98 vs. 79.5.
Where Docs7 saves time
Docs7 put the main content on the screen sooner. Google calls this the largest-content paint. Across the 17 pages, the median was 3.3 seconds vs. 9.7 seconds in Google's throttled phone test, and 0.62 seconds vs. 1.02 seconds on desktop.
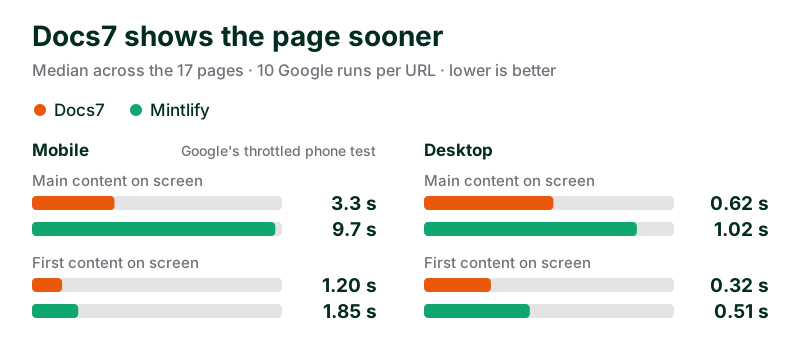
The measurements point to work in the browser. The Docs7 build prepares responsive image sizes, sets image dimensions so the layout does not shift, and defers images below the first screen. Docs7 pages also blocked the browser for less time. Across the 17 pages, the median blocking time was 199 ms vs. 389 ms on mobile and 166 ms vs. 228 ms on desktop.
Docs7 also compiles documentation into static HTML at build time, and Cloudflare's static-asset network serves those files. The browser receives the content directly, with JavaScript for interactive features.
Pages with video were the slowest group for Docs7 on both devices. On the video page, the median largest-content paint on mobile was 4.20 seconds on Docs7 vs. 12.91 seconds on Mintlify. Mobile runs on this page varied a lot on both hosts, from 2.9 to 16.5 seconds on Docs7 and from 3.3 to 21.1 seconds on Mintlify.
We do not know how Mintlify works internally, and these tests do not show how much of the difference comes from each design choice.
Method and limits
Google ran all 680 tests on September 17, 2026, using Lighthouse 13.4.1. DebugBear results include follow-up runs on September 18. For repeated tests we use the median on both hosts, following Google's guidance on repeated runs. Every page has equal weight, and we keep devices and services separate.
These are lab tests of the first page load on deployed sites. We did not play the videos or measure interaction latency. We did not control cache state, and the paired runs were not always simultaneous.
We also ran Pingdom load-time checks from San Francisco, Frankfurt, and Tokyo. Most pages have only one run per URL, which is too thin for a regional speed claim, so those numbers are in the appendix only.
Check the data
Read the full results on GitHub for the test settings, run counts, and every DebugBear and Pingdom report link. We also published the 680 Google measurements as CSV, so you can recalculate every Google number in this post.
To host your documentation on Docs7, start at context7.com/docs7.